Introduction
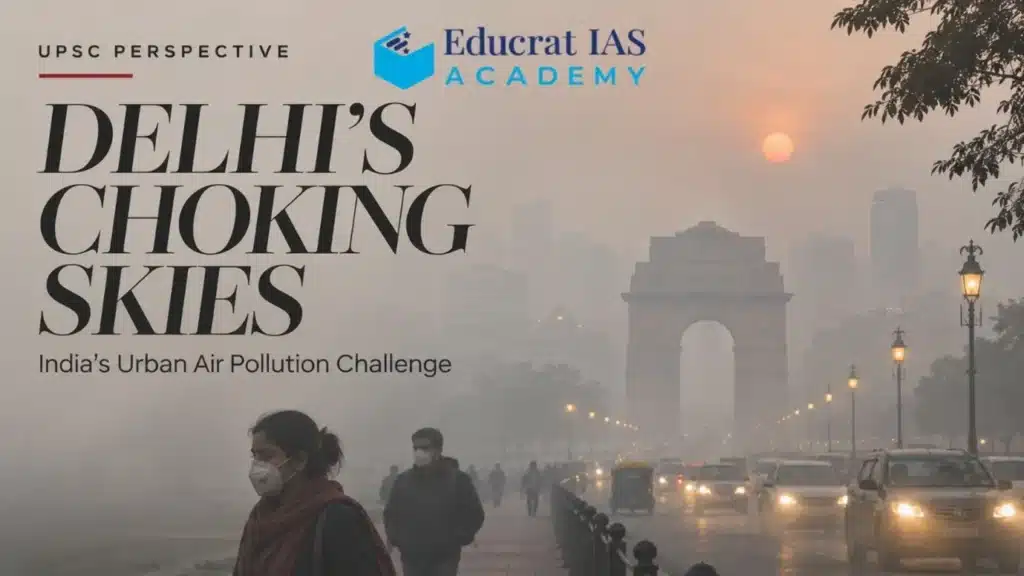
Every winter, Delhi’s air pollution returns to public attention. Reduced visibility, high pollution readings and restrictions under the Graded Response Action Plan (GRAP) bring immediate measures into focus. But the problem is not confined to a few weeks or to Delhi alone. It reflects deeper challenges in urban planning, transport, energy use, waste management and coordination across state boundaries.
As of 10 November 2026, the Commission for Air Quality Management (CAQM) has invoked Stage III of GRAP across the National Capital Region, effective 6 November. This is a current response to worsening air quality; the long-term challenge is to reduce emissions throughout the year.
For the UPSC aspirant, Delhi’s choking skies connect environmental degradation with public health, federalism, governance, urbanisation, economic development and environmental justice.
What is urban air pollution?
Air pollution occurs when harmful gases, particles or biological materials accumulate in the atmosphere at concentrations that affect health or the environment. In cities, commonly monitored pollutants include:
- PM₂.₅: Fine particles that can travel deep into the lungs and enter the bloodstream.
- PM₁₀: Coarser particles that can enter the respiratory tract.
- Nitrogen dioxide and sulphur dioxide: Gases associated with combustion, including transport, power generation and industry.
- Ground-level ozone: A pollutant formed through chemical reactions in sunlight.
- Carbon monoxide: A gas produced by incomplete combustion.
The Air Quality Index (AQI) converts readings for selected pollutants into a scale that helps communicate air quality and associated health concerns. It is useful for public information, but a single AQI reading cannot explain every source of pollution or capture a person’s total exposure over time. CPCB’s National AQI uses sub-indices and health breakpoints for eight pollutants.
Why does Delhi’s air quality deteriorate?
Delhi’s air pollution has no single cause. Emissions from many activities combine with weather conditions that can prevent pollutants from dispersing.
1. Transport emissions
A large and growing vehicle fleet contributes exhaust emissions and congestion. Older vehicles, heavy-duty traffic and diesel generators can add to pollution. Congestion also means vehicles spend longer on roads, increasing fuel use and emissions.
2. Road dust and construction
Dust from unpaved shoulders, damaged roads, construction sites and material transport contributes to particulate pollution. Poorly managed construction and uncovered building materials can add to dust exposure near roads and residential areas.
3. Industry, power and fuel use
Industrial units, power generation, commercial establishments and households can release pollutants when they rely on polluting fuels or operate without effective emission controls. The impact depends on the type of fuel, technology, location and strength of enforcement.
4. Waste burning and landfill fires
Open burning of municipal waste and other materials releases fine particles and toxic pollutants. Landfill fires can create prolonged local pollution and affect nearby communities.
5. Seasonal crop-residue burning
Crop-residue burning in parts of Punjab, Haryana and Uttar Pradesh can contribute to pollution episodes when winds carry smoke towards Delhi. It is part of the seasonal picture, but it should not be treated as the only explanation for Delhi’s air pollution. Pollution sources differ by season and location, and local emissions continue throughout the year.
CAQM has noted that emissions, weather and atmospheric chemical processes all shape pollution across Delhi-NCR. It has also highlighted the need for stronger emission inventories and source-apportionment studies; estimates can vary with the methods and data used.
6. Weather and geography
During winter, low wind speeds, temperature inversion and a lower atmospheric mixing height can keep pollutants closer to the ground. Weather does not create all the pollution, but it can make the effects of existing emissions more severe by limiting dispersion.
This combination of local emissions, regional transport and winter weather explains why the pollution crisis cannot be solved through one seasonal restriction or one source-control measure.
Health and social impacts: Who is affected?
Air pollution affects people differently depending on their health, work, age, location and ability to reduce exposure. The impacts are not limited to one group or determined by gender; they are shaped by the conditions in which people live, work and travel.
Children and students
- Explanation: Developing lungs and frequent outdoor activity can make children more exposed to polluted air. Symptoms or illness can disrupt attendance, play and concentration.
- Data: The State of Global Air 2025 report estimated more than two million air-pollution-attributable deaths in India in 2023. This is a national estimate across air-pollution sources, not a Delhi-only count.
- Example: A school may shift sports or assembly indoors during a severe pollution episode, while families seek medical care for children with breathing difficulties.
Older adults and people with existing health conditions
- Explanation: People with respiratory or cardiovascular conditions may face aggravated symptoms during periods of high pollution. Older adults can also have fewer options to avoid outdoor exposure.
- Data: WHO identifies fine-particle exposure as a risk associated with cardiovascular and respiratory disease.
- Example: A person managing asthma or heart disease may need to limit outdoor activity or seek additional medical advice when air quality deteriorates.
Outdoor and transport workers
- Explanation: Street vendors, traffic personnel, delivery workers, sanitation workers and construction workers can spend long hours outdoors. Their work may make it difficult to avoid exposure or change travel times.
- Data: A Delhi mortality study found an association between short-term PM₂.₅ exposure and daily non-accidental mortality; it reported a stronger association among people aged 60 and over. The study does not establish that every individual’s illness is caused by a particular day’s pollution.
- Example: A delivery worker completing a shift on congested roads has sustained outdoor exposure, while an indoor worker may have more flexibility to reduce time outside.
Households and neighbourhoods
- Explanation: Residents near major roads, construction sites, industrial areas or waste-burning sites can experience higher local exposure. Access to cleaner indoor spaces and healthcare also varies between households.
- Data: WHO notes that air pollution affects people across income groups, while low- and middle-income populations experience a disproportionate share of the global burden.
- Example: A neighbourhood beside a busy traffic corridor may face a different exposure profile from one with less traffic, even when both are within the same city.
Economic and urban-development costs
Poor air quality creates costs for households, employers, public services and the wider city. The figures below are estimates from specified years and should be read as evidence of the scale of the burden, not as a current annual bill.
Households and healthcare systems
- Explanation: Illness can mean medical expenses, time away from work or school, and added demand on clinics and hospitals.
- Data: A 2019 India-wide study estimated economic losses of US$8 billion from air-pollution-related morbidity, using a cost-of-illness approach.
- Example: A family may face consultation and medicine costs while also losing income when a working member needs time to recover.
Workers and employers
- Explanation: Illness and reduced ability to work can lower productivity. Outdoor workers may face exposure as part of their job, while employers can face absenteeism and higher health-related costs.
- Data: The World Bank estimated that lost output from premature deaths and illness linked to air pollution cost India US$36.8 billion in 2019, equivalent to 1.36% of GDP.
- Example: A construction project may face disruptions when workers are unwell or when pollution-control directions restrict certain activities during a severe episode.
Businesses, mobility and city liveability
- Explanation: Congestion, poor visibility and pollution-related advisories can disrupt logistics, outdoor commerce and routine travel. Persistent poor air quality can also weaken a city’s appeal as a place to live and work.
- Data: A 2019 study estimated that Delhi had the highest per-capita economic loss from air pollution among Indian states and Union Territories in its analysis.
- Example: Street-facing businesses may see reduced outdoor footfall during pollution episodes, while delivery and transport services must continue operating in difficult conditions.
Urban planning and public spending
- Explanation: Cities may need to spend more on health services, dust control, monitoring and emergency response when pollution becomes severe. Poorly planned growth can lock in car dependence and long commutes.
- Data: Under NCAP, 130 cities have city-specific clean-air action plans; implementation and expenditure are tracked through the PRANA portal.
- Example: Investments in reliable buses and safer walking routes can reduce transport emissions while also improving access to jobs and services.
Governance and institutional challenges
Delhi’s air pollution crosses administrative boundaries and involves many sectors. Effective action depends on agencies sharing data, aligning priorities and implementing decisions consistently.
Fragmented responsibilities across the airshed
- Explanation: Transport, roads, construction, waste, industry and agriculture are managed by different agencies and governments. Pollution can move across state borders, while enforcement authority may remain divided.
- Data: CAQM’s framework identifies sources across Delhi-NCR and stresses the need for robust emission inventories and source-apportionment studies to guide policy.
- Example: A pollution-control measure in Delhi may have limited effect if connected sources in adjoining NCR areas are not addressed at the same time.
Emergency action versus year-round prevention
- Explanation: GRAP enables authorities to intensify action as air quality worsens, but seasonal restrictions do not substitute for continuous source reduction.
- Data: As of 10 November 2026, CAQM reported Stage III GRAP actions in force across NCR, effective 6 November.
- Example: Construction restrictions may be needed during a severe episode, while dust suppression, site compliance and better road design must continue throughout the year.
Monitoring, evidence and accountability
- Explanation: Monitoring can show where pollution is high, but authorities also need credible source data, clear responsibility and follow-up on violations.
- Data: In a July 2026 government update, 108 NCAP cities recorded lower annual PM₁₀ concentrations in 2025–26 than in 2017–18. This is a national programme result and does not mean all cities or pollutants improved equally.
- Example: A public dashboard can help residents compare local readings, while an inspection and enforcement system is needed to address repeat violations.
Stakeholders and their roles
- Residents and commuters: Need timely, understandable advisories and practical alternatives such as reliable public transport. For example, a bus commuter can benefit from service improvements, while residents need clear guidance during high-pollution days.
- Workers and businesses: Need predictable rules, workplace safeguards and support to comply. For example, construction firms need workable dust-control standards, and outdoor workers need measures that reduce avoidable exposure.
- Farmers and rural communities: Need affordable residue-management options and markets for crop residue. For example, timely access to machinery can make alternatives more feasible than burning.
- Municipal bodies and regulators: Need staff, funding, data and authority to carry out inspections and maintain roads, waste systems and construction controls.
- Healthcare providers and civil society: Can support risk communication, public-health surveillance and community feedback, especially in highly exposed neighbourhoods.
Legal and constitutional framework
India’s legal framework recognises environmental protection as a public responsibility and provides authorities with powers to regulate pollution. The challenge is to make enforcement timely, consistent and fair to affected communities.
Constitutional duties and the right to life
- Explanation: Article 48A directs the State to protect and improve the environment; Article 51A(g) places a duty on citizens to protect and improve the natural environment. The Supreme Court has read the right to a pollution-free environment within Article 21’s protection of life.
- Data / legal anchor: These provisions appear in the Constitution of India, and the Supreme Court has recognised pollution-free air as part of the Article 21 guarantee.
- Example: Residents may seek information or legal remedies when public authorities fail to address serious pollution risks, while public agencies are expected to act within their statutory responsibilities.
Statutory regulation and enforcement
- Explanation: The Air (Prevention and Control of Pollution) Act, 1981 provides a framework for preventing and controlling air pollution. The Environment (Protection) Act, 1986 empowers the Union government to take measures to protect and improve environmental quality.
- Data / legal anchor: Both Acts are listed in India Code as central environmental legislation.
- Example: Pollution-control authorities can set conditions, inspect regulated facilities and act on non-compliance under the applicable legal framework.
Courts, tribunals and institutional accountability
- Explanation: Courts and environmental tribunals can review government action, require compliance with laws and address disputes involving environmental harm. They can support accountability, but cannot replace routine administration and enforcement.
- Data / legal anchor: Article 21 environmental jurisprudence and statutory environmental laws form part of the legal basis for scrutiny of pollution-control decisions.
- Example: Judicial directions may require agencies to report on compliance or implement pollution-control measures; long-term results still depend on agencies carrying them out.
Stakeholder lens: rights, duties and a fair transition
- Explanation: Residents have an interest in clean air; businesses and transport operators must comply with emission rules; governments must protect public health; and workers and farmers need feasible ways to adjust to new requirements.
- Data / legal anchor: Article 51A(g) recognises an environmental duty for citizens, while Article 48A places environmental protection within the State’s directive principles.
- Example: A fair transition could pair stricter vehicle or residue-burning rules with accessible public transport, worker protections and affordable alternatives for farmers and small businesses.
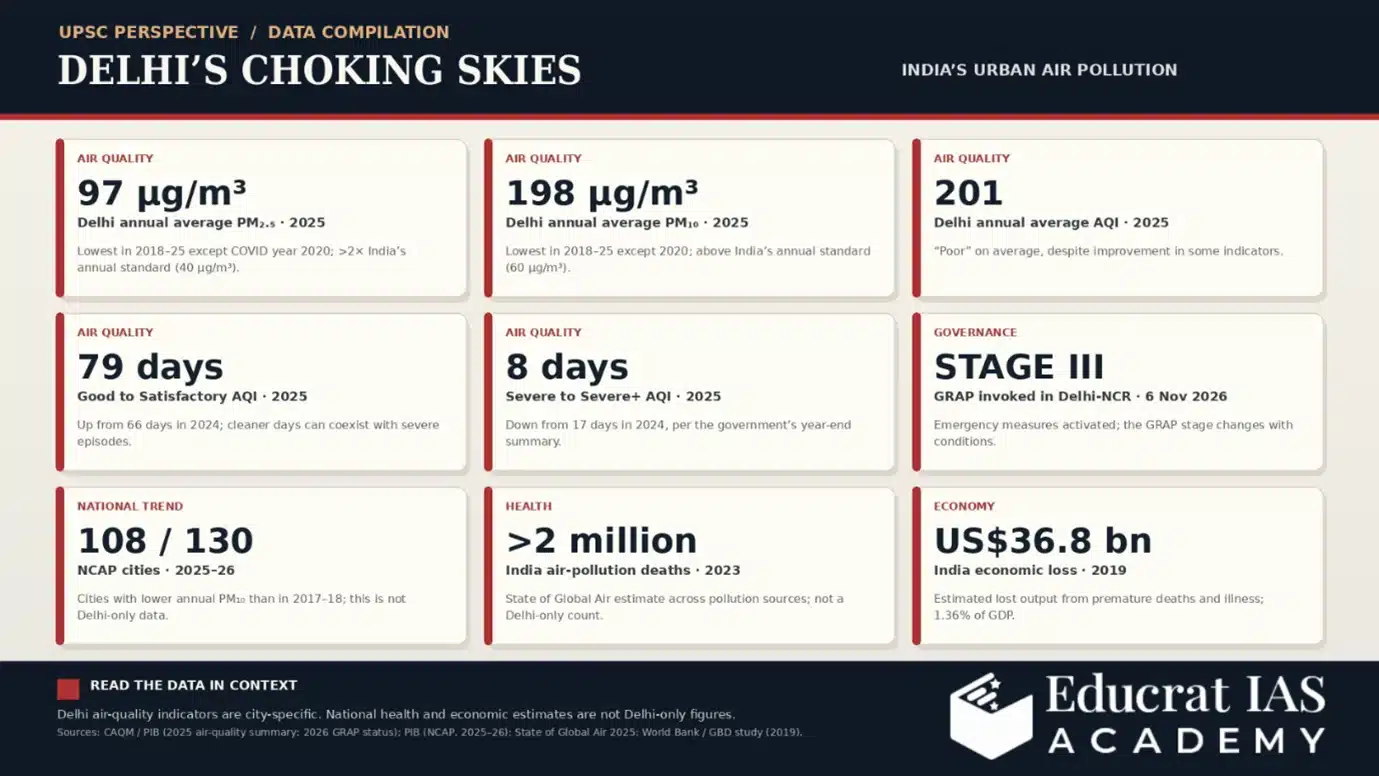
Data Compilation on Delhi’s Choking Skies & India’s Urban Air Pollution
| Indicator | Data | What it shows |
| Delhi annual average PM₂.₅, 2025 | 97 µg/m³ | The lowest annual average in the 2018–2025 period, excluding the COVID-affected year 2020; still more than twice India’s annual PM₂.₅ standard of 40 µg/m³. |
| Delhi annual average PM₁₀, 2025 | 198 µg/m³ | Also the lowest in the 2018–2025 period, excluding 2020; remains above India’s annual PM₁₀ standard of 60 µg/m³. |
| Delhi annual average AQI, 2025 | 201 | Indicates that annual air quality remained in the “Poor” range on average, even though some indicators improved. |
| Delhi “Good” to “Satisfactory” AQI days, 2025 | 79 days | A rise from 66 days in 2024; the number of cleaner-air days can improve while serious seasonal episodes persist. |
| Delhi “Severe to Severe+” days, 2025 | 8 days | Down from 17 days in 2024, according to the government’s year-end air-quality summary. |
| GRAP status in Delhi-NCR, 6 November 2026 | Stage III invoked | Shows the need for emergency measures when air quality is forecast to worsen; the stage can change with conditions. |
| NCAP cities with lower annual PM₁₀ in 2025–26 than in 2017–18 | 108 of 130 cities | Indicates improvement across many participating cities, but is not a Delhi-only result and does not cover every pollutant equally. |
| India air-pollution-attributable deaths, 2023 | More than 2 million | A national estimate from State of Global Air 2025; it includes multiple forms of air pollution and is not a Delhi-only estimate. |
| India economic loss from air pollution, 2019 | US$36.8 billion; 1.36% of GDP | A study estimate combining lost output from premature deaths and illness; it is not a current-year budget figure. |
How to use these figures: State the year, geography and measure alongside every statistic. Delhi’s city-level readings should not be presented as India-wide data, and national health or economic estimates should not be described as Delhi-specific figures.
UPSC perspective
Delhi’s air pollution can be analysed across several General Studies areas:
- GS I: Urbanisation, migration and the challenges of metropolitan growth.
- GS II: Centre-state relations, inter-state coordination and institutional accountability.
- GS III: Environmental pollution, public health, sustainable development and disaster management.
- GS IV: Environmental ethics, public responsibility, intergenerational equity and the duty of care.
A strong UPSC answer should avoid reducing the issue to one cause. It should explain the interaction of emissions, weather and regional geography; discuss the unequal health burden; assess existing institutions and policies; use dated data carefully; and conclude with a practical, coordinated way forward.
Conclusion
Delhi’s choking skies are a warning about the costs of unplanned urban growth and fragmented environmental governance. Cleaner air requires more than emergency restrictions: it demands sustained emissions reduction, reliable public services, evidence-based policy and coordination across the entire airshed.
For India, the larger goal is to make clean air a basic feature of liveable, inclusive and climate-resilient cities.
Prepare for UPSC with EDUCRAT IAS ACADEMY
Build a stronger understanding of current affairs and their links to the UPSC syllabus with EDUCRAT IAS ACADEMY.
For course and counselling enquiries, contact 9163228921.