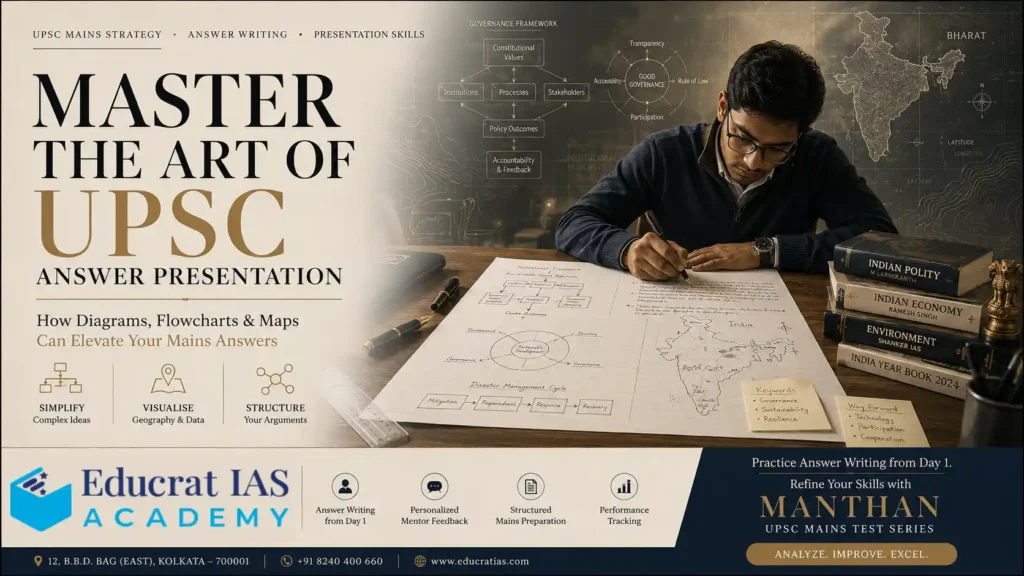
Every year, thousands of aspirants prepare diligently for the UPSC Civil Services Examination. They complete standard textbooks, revise current affairs, practice answer writing, and solve previous years’ question papers. Yet, many struggle to convert their hard work into high scores in the UPSC Mains Examination. One of the biggest differentiators between an average answer and a high-scoring one is not just the quality of content: it is the quality of presentation.
The UPSC Mains examination is not merely a test of knowledge; it is a test of how effectively you can communicate your ideas within a limited word limit and time. Since examiners evaluate hundreds of answer sheets, they often spend only a few minutes on each response. A well-structured answer that is easy to read, logically organized, and visually engaging naturally creates a stronger impression than a dense block of text.
This is where diagrams, flowcharts, and maps become powerful answer-writing tools. A simple flowchart can explain a complex governance process in seconds, a well-drawn map can instantly demonstrate geographical understanding, and a neat diagram can simplify interconnected concepts, making your answer more analytical, concise, and memorable. These visual elements not only save words but also showcase conceptual clarity, structured thinking, and administrative aptitude: qualities that UPSC expects from future civil servants.
However, simply drawing diagrams is not enough. Knowing when, where, and how to use them strategically can significantly improve the overall quality of your answers. At EDUCRAT IAS Academy, UPSC Coaching Centre in Kolkata, this philosophy is embedded into the preparation process through UPSC MAINS Answer Writing Practice from Day 1, enabling aspirants to develop effective presentation skills alongside conceptual understanding. With continuous mentor feedback and structured evaluation, students learn to integrate diagrams, flowcharts, and maps naturally into their answers, making them both examiner-friendly and score-worthy.
Key Takeaways
- Makes answers easier to read.
- Helps examiners grasp ideas quickly.
- Demonstrates conceptual clarity.
- Improves answer organization.
- Enhances the overall presentation.
- Leaves a lasting impression on the evaluator.
Why Does UPSC Encourage Visual Representation?
UPSC seeks future administrators who can simplify complex issues and communicate them efficiently. In real-life governance, civil servants frequently prepare reports, presentations, policy briefs, and administrative notes that rely on charts, diagrams, and visual summaries. By using diagrams and flowcharts in your Mains answers, you demonstrate the ability to organize information logically and present it in an accessible format. It reflects analytical thinking rather than rote memorization and shows that you understand the relationships between different concepts instead of merely recalling facts.
Aspirants who consistently practice visual representation develop an administrative style of thinking: breaking down complex governance issues into simple, actionable frameworks. This is precisely why UPSC Mains answer-writing practice remains an integral part of the UPSC learning process at EDUCRAT IAS Academy.
Key Takeaways
- Reflects analytical thinking.
- Demonstrates conceptual understanding.
- Simplifies complex administrative issues.
- Shows structured problem-solving ability.
- Mirrors real-world governance practices.
Understanding the Three Visual Tools
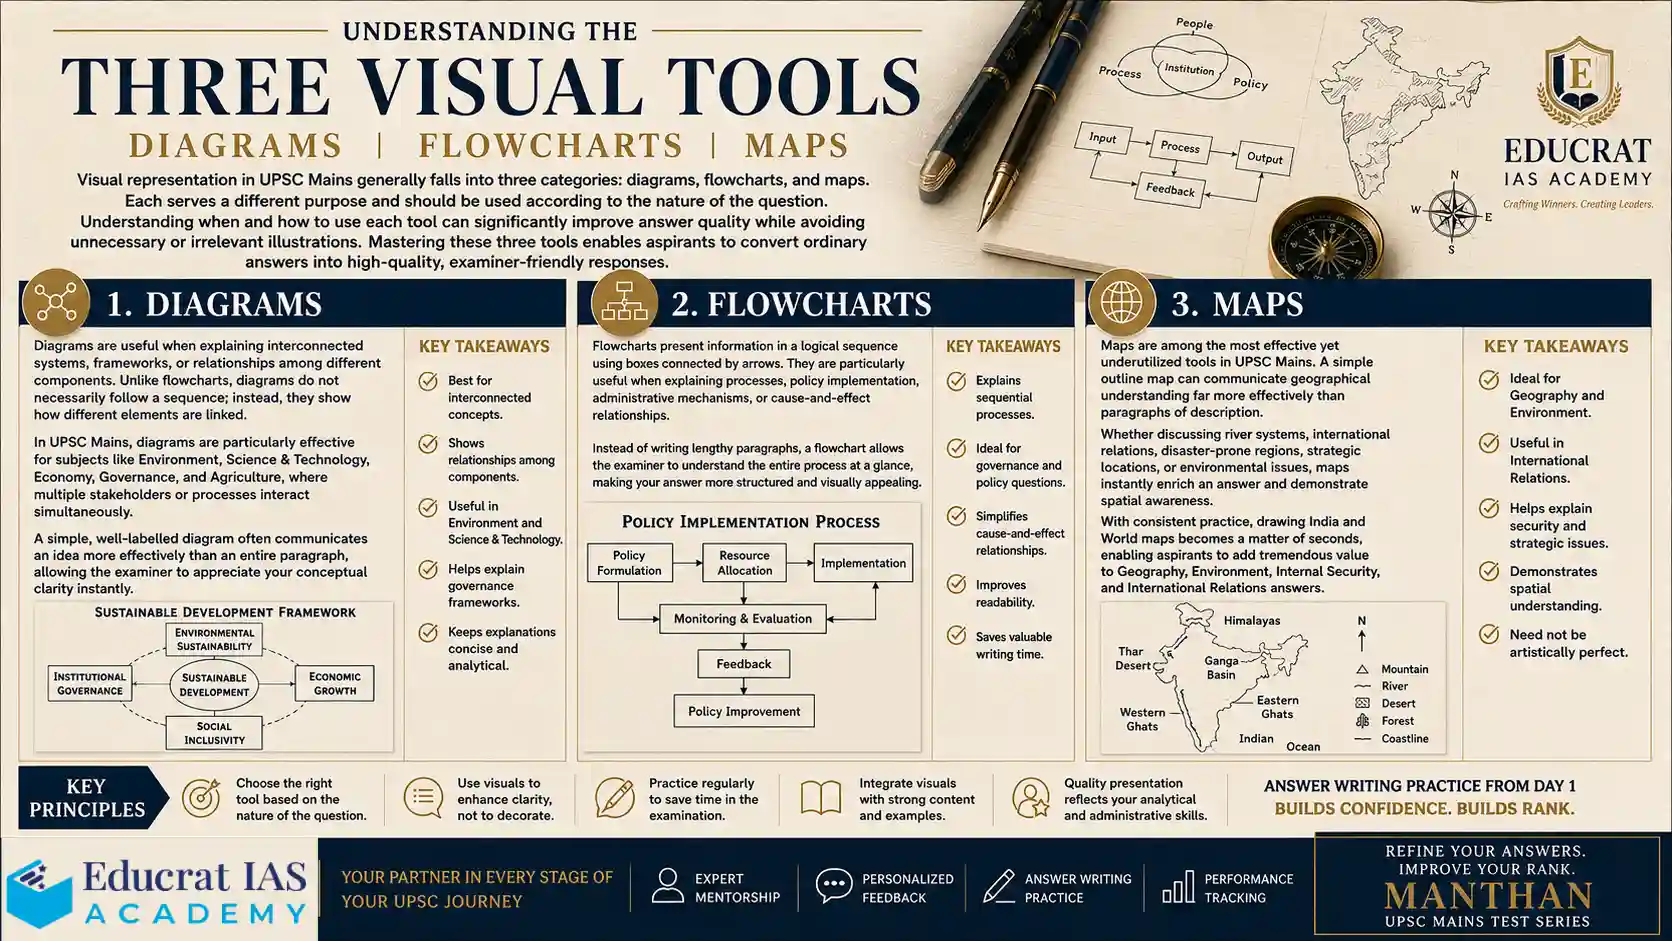
Visual representation in UPSC Mains generally falls into three categories: diagrams, flowcharts, and maps. Each serves a different purpose and should be used according to the nature of the question. Understanding when and how to use each tool can significantly improve answer quality while avoiding unnecessary or irrelevant illustrations. Mastering these three tools enables aspirants to convert ordinary answers into high-quality, examiner-friendly responses.
Key Takeaways
- Diagrams explain structures and relationships.
- Flowcharts explain processes and sequences.
- Maps explain geographical and spatial aspects.
- Use the appropriate visual based on the question.
- Avoid using visuals merely for decoration.
Diagrams
Diagrams are useful when explaining interconnected systems, frameworks, or relationships among different components. Unlike flowcharts, diagrams do not necessarily follow a sequence; instead, they show how different elements are linked. In UPSC Mains, diagrams are particularly effective for subjects like Environment, Science & Technology, Economy, Governance, and Agriculture, where multiple stakeholders or processes interact simultaneously.
A simple, well-labelled diagram often communicates an idea more effectively than an entire paragraph, allowing the examiner to appreciate your conceptual clarity instantly.
Key Takeaways
- Best for interconnected concepts.
- Shows relationships among components.
- Useful in Environment and Science & Technology.
- Helps explain governance frameworks.
- Keeps explanations concise and analytical.
Flowcharts
Flowcharts present information in a logical sequence using boxes connected by arrows. They are particularly useful when explaining processes, policy implementation, administrative mechanisms, or cause-and-effect relationships. Instead of writing lengthy paragraphs, a flowchart allows the examiner to understand the entire process at a glance, making your answer more structured and visually appealing.
One of the major reasons students struggle in Mains is their inability to organize thoughts within the word limit. Through regular answer-writing sessions at EDUCRAT IAS Academy, UPSC Coaching in Kolkata aspirants learn to convert lengthy explanations into crisp and effective flowcharts without compromising analytical depth.
Key Takeaways
- Explains sequential processes.
- Ideal for governance and policy questions.
- Simplifies cause-and-effect relationships.
- Improves readability.
- Saves valuable writing time.
Maps
Maps are among the most effective yet underutilized tools in UPSC Mains. A simple outline map can communicate geographical understanding far more effectively than paragraphs of description. Whether discussing river systems, international relations, disaster-prone regions, strategic locations, or environmental issues, maps instantly enrich an answer and demonstrate spatial awareness.
With consistent practice, drawing India and World maps becomes a matter of seconds, enabling aspirants to add tremendous value to Geography, Environment, Internal Security, and International Relations answers.
Key Takeaways
- Ideal for Geography and Environment.
- Useful in International Relations.
- Helps explain security and strategic issues.
- Demonstrates spatial understanding.
- Need not be artistically perfect.
Benefits of Using Diagrams, Flowcharts and Maps
Visual tools improve both the quality and effectiveness of your answers. They reduce unnecessary writing, organize information logically, and make complex ideas easier to understand. More importantly, they create a balanced answer sheet that reflects clarity, confidence, and analytical ability: all qualities that UPSC values in future civil servants.
Aspirants who regularly integrate visuals into their answers often find that they can communicate more ideas within the prescribed word limit while making their copies significantly more examiner-friendly.
Key Takeaways
- Enhances presentation.
- Saves time.
- Improves conceptual clarity.
- Makes answers memorable.
- Highlights analytical thinking.
- Creates visually balanced answers.
Where Should You Use Visuals?
Visuals should not be inserted randomly into every answer. Their purpose is to improve clarity, not occupy space. They work best when they help explain concepts that are otherwise difficult to describe through text alone. Strategic placement of diagrams can strengthen introductions, simplify complex arguments, or conclude an answer effectively.
Learning where to place a visual is just as important as learning how to draw one. During answer evaluation, mentors at IAS Coaching Institute in Kolkata, EDUCRAT IAS Academy guide aspirants on using visuals strategically rather than excessively.
Key Takeaways
- Use in introductions for conceptual clarity.
- Explain processes in the main body.
- Illustrate institutional frameworks.
- Summarize solutions in conclusions.
- Use only when they add value.
Subject-wise Usage of Visuals
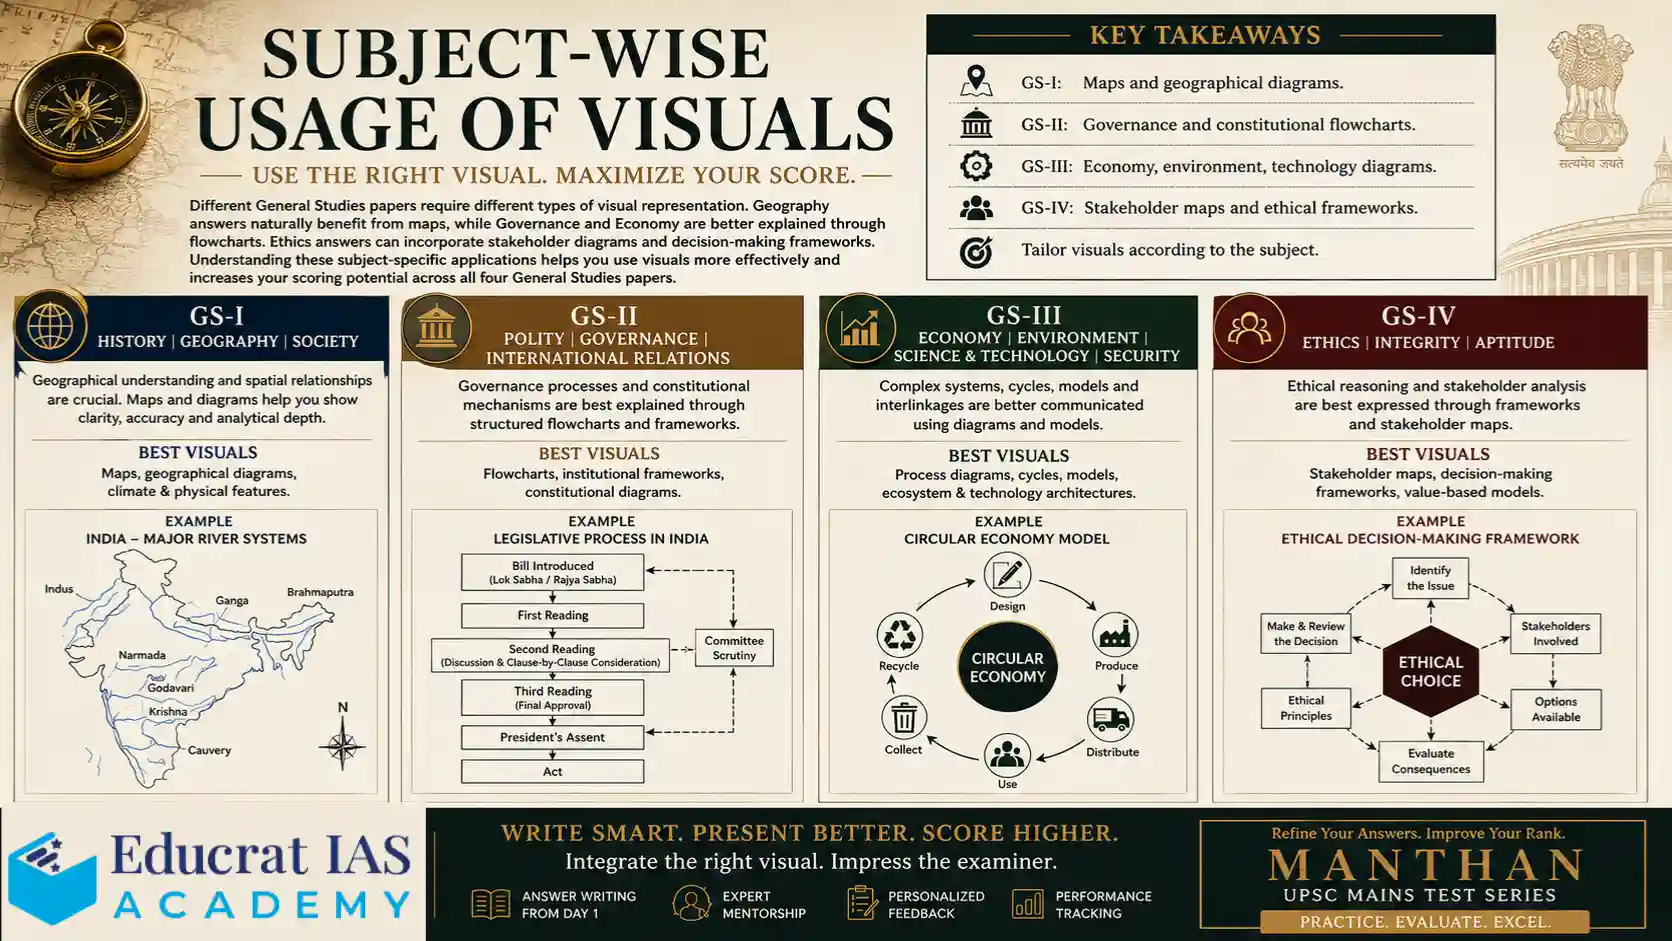
Different General Studies papers require different types of visual representation. Geography answers naturally benefit from maps, while Governance and Economy are better explained through flowcharts. Ethics answers can incorporate stakeholder diagrams and decision-making frameworks. Understanding these subject-specific applications helps you use visuals more effectively and increases your scoring potential across all four General Studies papers.
Key Takeaways
- GS-I: Maps and geographical diagrams.
- GS-II: Governance and constitutional flowcharts.
- GS-III: Economy, environment, technology diagrams.
- GS-IV: Stakeholder maps and ethical frameworks.
- Tailor visuals according to the subject.
How to Draw Effective Flowcharts
A flowchart should simplify information rather than complicate it. It should contain only keywords connected by arrows in a logical sequence. Avoid writing complete sentences inside boxes, as that defeats the purpose of visual representation. The best flowcharts are simple, clean, and easy to understand within a few seconds.
Key Takeaways
- Keep boxes small.
- Use keywords only.
- Connect ideas logically.
- Maintain a clear flow.
- Avoid clutter.
How to Draw Effective Diagrams
Good diagrams emphasize clarity over artistic beauty. They should be large enough to read comfortably, neatly labelled, and directly relevant to the question. Every line, box, or arrow should contribute to explaining the concept. Unnecessary decoration or excessive detailing should always be avoided.
Key Takeaways
- Draw neatly.
- Label every component.
- Keep it simple.
- Avoid excessive detailing.
- Focus on relevance.
Using Maps Effectively
Maps should be drawn only when they strengthen your answer. A rough outline of India or the world, with important locations correctly marked, is sufficient for UPSC Mains. Examiners assess your geographical understanding rather than your drawing skills. Therefore, accuracy and relevance matter much more than perfection.
Key Takeaways
- Draw simple outlines.
- Mark important locations accurately.
- Label clearly.
- Use directional indicators when needed.
- Practice commonly used maps regularly.
Common Mistakes Aspirants Make
Many aspirants either avoid visuals completely or overuse them. Both approaches can reduce answer quality. A diagram should support the written content, not replace it. Similarly, spending excessive time drawing elaborate figures can negatively impact overall paper completion.
Regular evaluation helps identify these mistakes early. At EDUCRAT IAS Academy, IAS Coaching Centre in Kolkata, mentors provide personalized feedback to ensure students gradually eliminate presentation errors and develop a polished answer-writing style.
Key Takeaways
- Don’t force diagrams into every answer.
- Avoid oversized illustrations.
- Don’t overcrowd visuals.
- Label properly.
- Don’t spend too much time drawing.
Practice Strategy
Like answer writing, visual representation also requires regular practice. Developing a repository of commonly used diagrams, governance frameworks, flowcharts, and maps allows you to reproduce them quickly during the examination. With consistent practice, these visuals become a natural part of your writing style and no longer consume additional time.
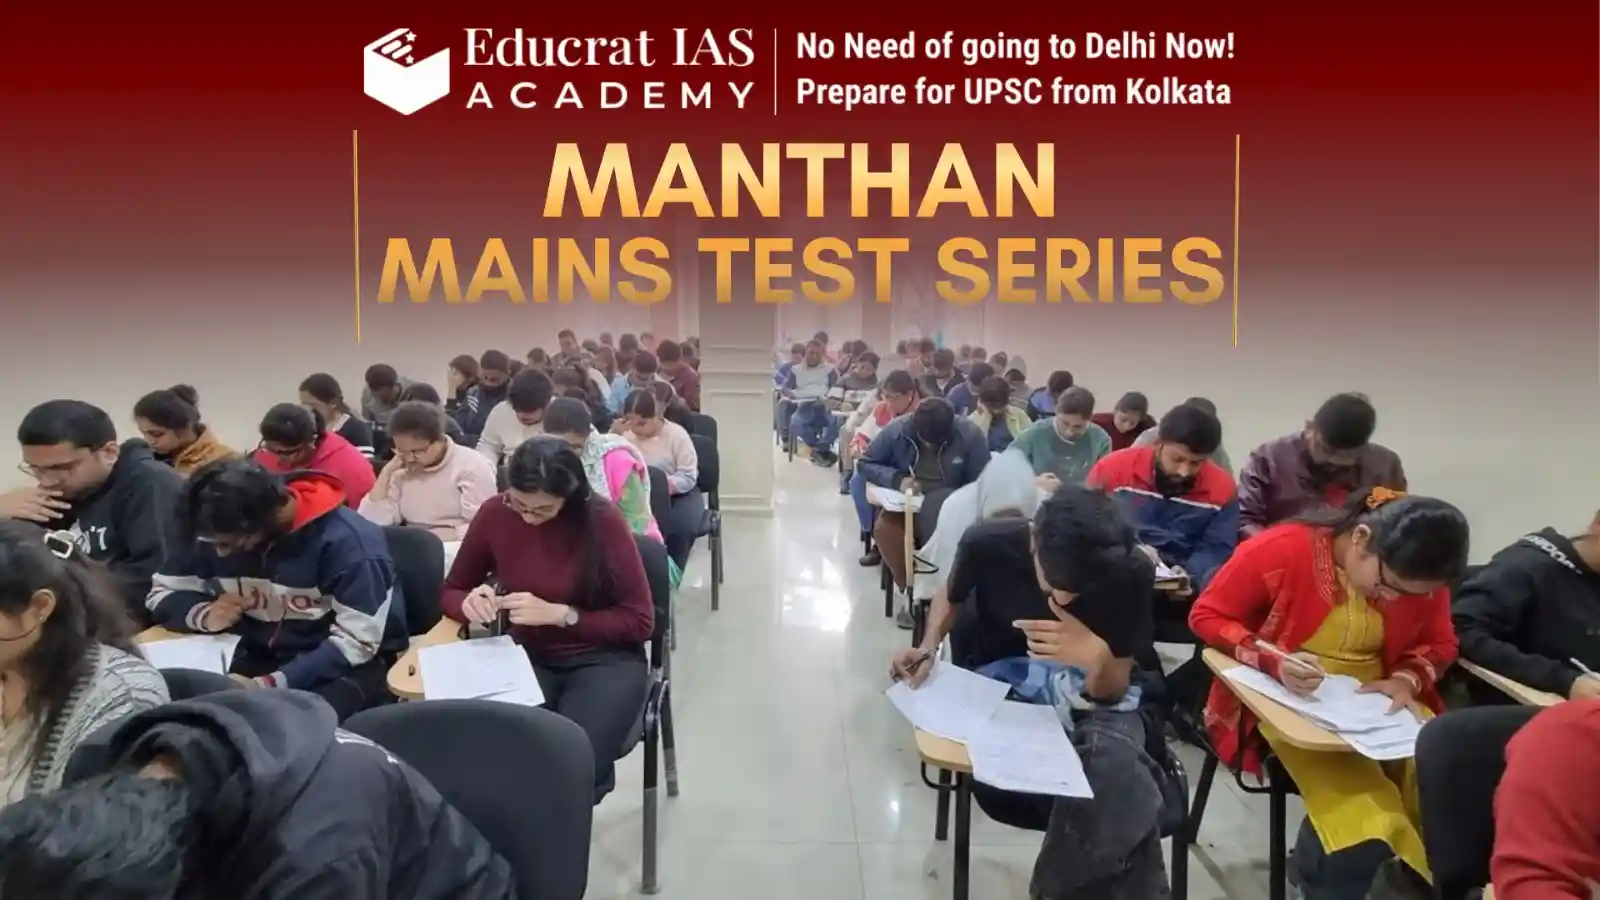
This is exactly why EDUCRAT IAS Academy, UPSC Coaching Centre in Kolkata, emphasizes Answer Writing Practice from Day 1. Students are encouraged to integrate diagrams, maps, and flowcharts into their daily answers so that these techniques become second nature by the time they appear for the UPSC Mains Examination. For advanced preparation, aspirants can further refine their writing through MANTHAN – UPSC Mains Test Series, where every answer is evaluated with detailed mentor feedback on content, structure, presentation, and value addition.
Key Takeaways
- Practice India maps regularly.
- Create standard governance flowcharts.
- Build a personal diagram repository.
- Revise frequently used frameworks.
- Integrate visuals into daily answer writing practice.
Conclusion
Diagrams, flowcharts, and maps are not shortcuts to scoring high marks, but they are powerful tools that enhance the quality of well-prepared answers. They improve readability, demonstrate analytical thinking, and make complex concepts easier to understand. However, they should always complement strong content rather than substitute it. When used thoughtfully and strategically, visual representation can significantly improve your answer presentation and help you stand out in the highly competitive UPSC Mains examination.
At EDUCRAT IAS Academy, IAS Coaching in Kolkata, we believe that exceptional answers are built through consistent practice, expert mentorship, and continuous evaluation. Whether you are beginning your UPSC journey through our Foundation Programme, developing answer-writing skills from Day 1, or preparing for the examination with the MANTHAN UPSC Mains Test Series, our focus remains the same: helping you write answers that are analytical, structured, and score-worthy.
Ready to Improve Your UPSC Mains Answer Writing?
If you’re serious about improving your Mains score, don’t wait until the final months to begin answer writing.
Join EDUCRAT IAS Academy, UPSC Coaching in Kolkata and build your answer-writing skills from Day 1 with expert mentorship, regular evaluation, and personalized feedback.
What You’ll Get at EDUCRAT IAS Academy, IAS Coaching Institute in Kolkata
- ✅ Daily Answer Writing Practice from Day 1
- ✅ Personalized Mentor Feedback
- ✅ Structured Mains-Oriented Preparation
- ✅ Diagram, Flowchart & Map Integration Techniques
- ✅ Value Addition for GS & Essay Papers
- ✅ MANTHAN UPSC Mains Test Series with comprehensive evaluation
- ✅ Performance Tracking and Continuous Improvement