
Cracking UPSC Mains 2026 requires more than conceptual clarity—it demands the ability to support arguments with credible data, government statistics, committee recommendations, reports, indices, and contemporary examples. Well-structured, evidence-based answers demonstrate analytical depth and help aspirants move beyond generic statements.
This UPSC Mains 2026 Data Bank is a comprehensive repository of important facts, figures, statistics, government initiatives, constitutional provisions, committees, and institutional reports relevant to GS Papers I, II, III and IV and Essay. It brings together high-value data across major UPSC themes, helping aspirants access important information without having to search through multiple reports and sources.
The data bank covers key areas including Indian Diaspora and Migration, Poverty and Development, Rural Development, Urbanisation, Indian Polity and Governance, NGOs, Self-Help Groups, Cooperatives, Human Development, Democracy, Parliament, Fiscal Federalism, Judiciary, Elections, Local Self-Government, E-Governance, RTI, Corporate Governance, and Prison Reforms.
At Educrat IAS Academy, we understand that one of the biggest challenges in UPSC preparation is identifying which data is worth remembering and how to use it effectively in answers. This resource brings together high-value statistics in a structured format so that aspirants can revise important figures quickly and incorporate them meaningfully into their Mains answers.
The purpose of this data bank is not to encourage rote memorisation. Instead, it is designed to help aspirants use data to establish trends, substantiate arguments, highlight gaps, compare outcomes, demonstrate policy impact, and suggest reforms. A carefully placed statistic from a credible source can make an otherwise generic answer more precise, analytical and convincing.
How to Use This Data Effectively in UPSC Mains Answers
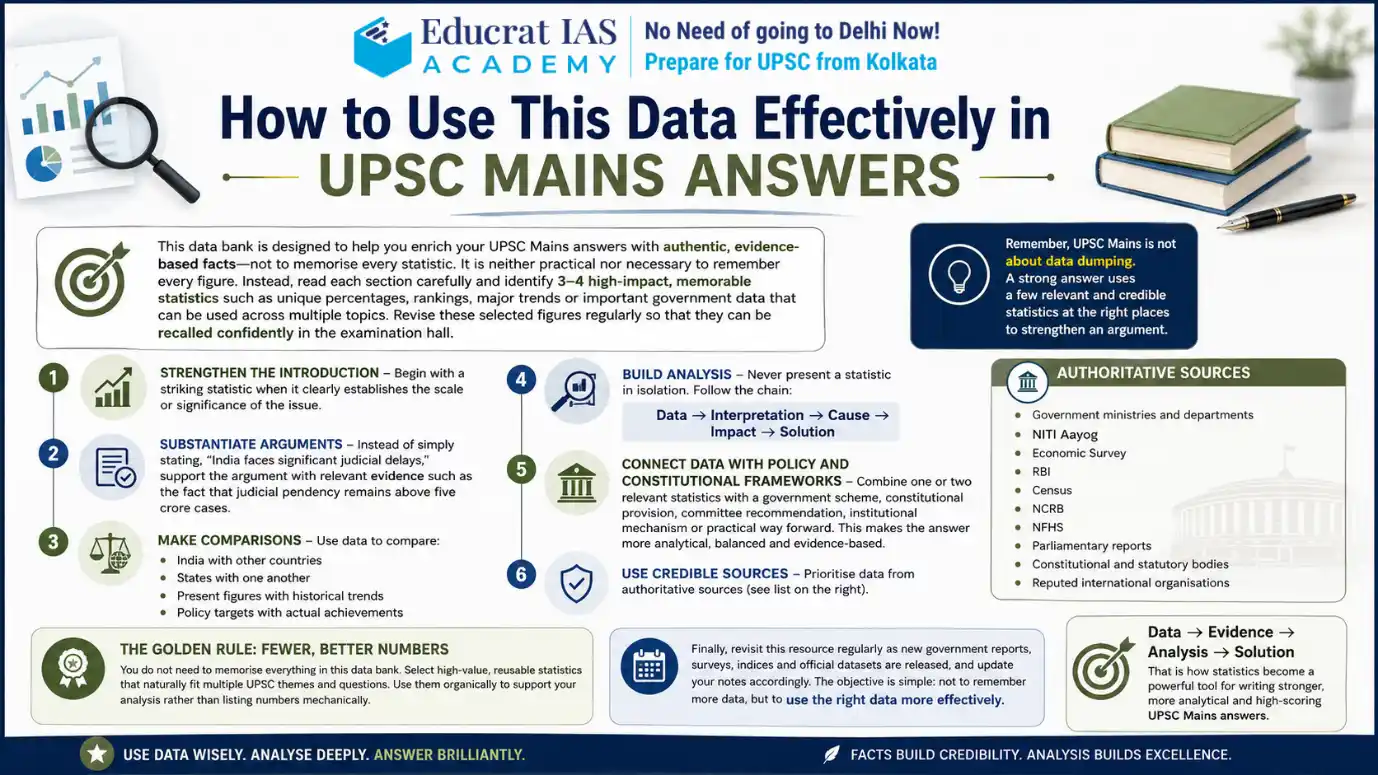
This data bank is designed to help you enrich your UPSC Mains answers with authentic, evidence-based facts—not to memorise every statistic. It is neither practical nor necessary to remember every figure. Instead, read each section carefully and identify 3–4 high-impact, memorable statistics such as unique percentages, rankings, major trends or important government data that can be used across multiple topics. Revise these selected figures regularly so that they can be recalled confidently in the examination hall.
Remember, UPSC Mains is not about data dumping. A strong answer uses a few relevant and credible statistics at the right places to strengthen an argument. Data can be used strategically to:
- Strengthen the introduction – Begin with a striking statistic when it clearly establishes the scale or significance of the issue.
- Substantiate arguments – Instead of simply stating, “India faces significant judicial delays,” support the argument with relevant evidence such as the fact that judicial pendency remains above five crore cases.
- Make comparisons – Use data to compare:
- India with other countries
- States with one another
- Present figures with historical trends
- Policy targets with actual achievements
- Build analysis – Never present a statistic in isolation. Follow the chain:
Data → Interpretation → Cause → Impact → Solution - Connect data with policy and constitutional frameworks – While answering questions on women’s empowerment, tribal development, social justice, governance, demographic dividend, inclusive growth and other themes, combine one or two relevant statistics with a government scheme, constitutional provision, committee recommendation, institutional mechanism or practical way forward. This makes the answer more analytical, balanced and evidence-based.
- Use credible sources – Prioritise data from authoritative sources such as:
- Government ministries and departments
- NITI Aayog
- Economic Survey
- RBI
- Census
- NCRB
- NFHS
- Parliamentary reports
- Constitutional and statutory bodies
- Reputed international organisations
The Golden Rule: Fewer, Better Numbers
You do not need to memorise everything in this data bank. Select high-value, reusable statistics that naturally fit multiple UPSC themes and questions. Use them organically to support your analysis rather than listing numbers mechanically.
Finally, revisit this resource regularly as new government reports, surveys, indices and official datasets are released, and update your notes accordingly. The objective is simple: not to remember more data, but to use the right data more effectively.
Data → Evidence → Analysis → Solution
That is how statistics become a powerful tool for writing stronger, more analytical and high-scoring UPSC Mains answers.
Indian Diaspora & Migration Data for UPSC CSE
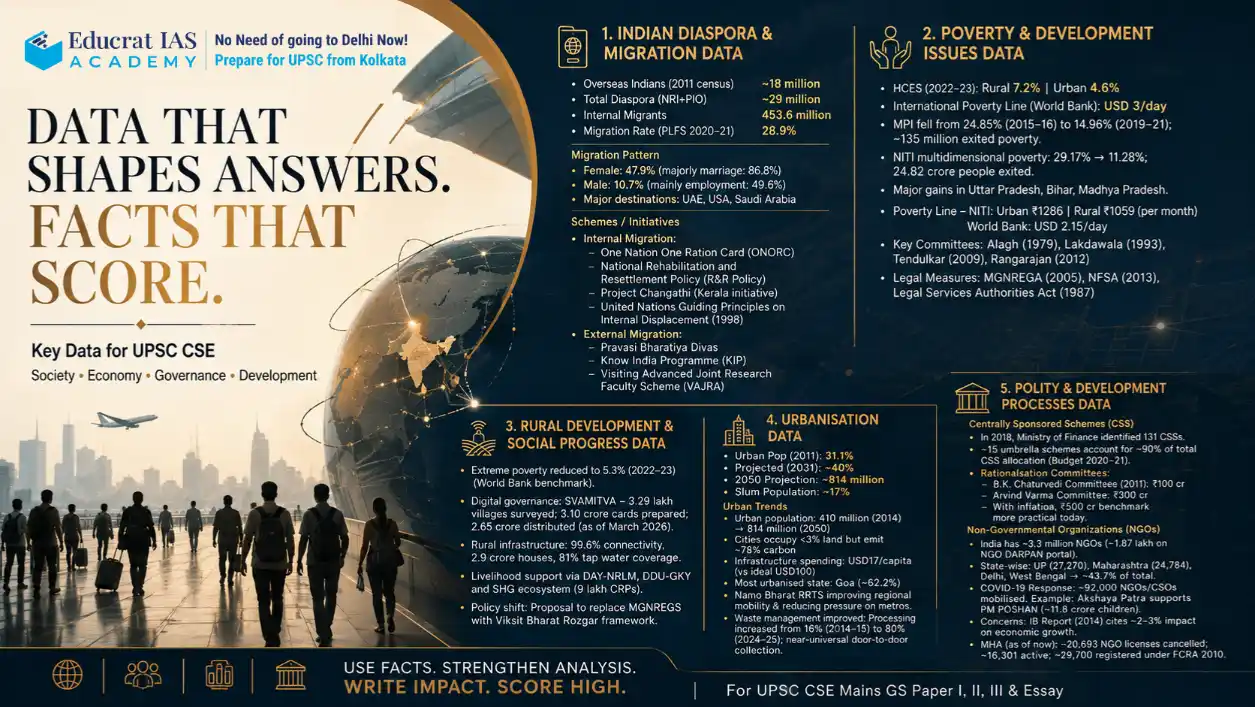
Migration is an important theme for UPSC MAINS GS Paper I, GS Paper II and Essay, linking society, employment, urbanisation, remittances, social security and India’s external relations. Migration patterns also reveal significant gender differences. Female migration is predominantly associated with marriage, while male migration is more strongly linked to employment. Major international destinations include the UAE, USA and Saudi Arabia.
| Indicator | Value |
| Overseas Indians (2011 census) | ~18 million |
| Total Diaspora (NRI+PIO) | ~29 million |
| Internal Migrants | 453.6 million |
| Migration Rate (PLFS 2020–21) | 28.9% |
Migration Pattern
- Female: 9%(majorly marriage: 86.8%)
- Male: 7%(mainly employment: 49.6%)
- Major destinations: UAE, USA, Saudi Arabia
Schemes / Initiatives
- Internal Migration:
- One Nation One Ration Card (ONORC)
- National Rehabilitation and Resettlement Policy (R&R Policy)
- Project Changathi (Kerala initiative)
- United Nations Guiding Principles on Internal Displacement (1998)
- External Migration:
- Pravasi Bharatiya Divas
- Know India Programme (KIP)
- Visiting Advanced Joint Research Faculty Scheme (VAJRA)
Poverty & Development Issues Data for UPSC CSE
Poverty remains a core theme for UPSC MAINS GS Paper II, GS Paper III and Essay. Recent data shows significant improvement in several poverty indicators, but questions of inequality, human development and access to basic services remain important.
Status & Measurement
- HCES (2022–23):Rural poverty declined to ~7.2% (from 25.7% in 2011–12); urban to ~4.6% (from 13.7%).
- International Poverty Line (World Bank):USD 3/day (PPP-adjusted).
Multidimensional Poverty (MPI)
- MPI fell from 85% (2015–16)to 14.96% (2019–21); ~135 million exited poverty.
- Poverty intensity reduced from 1% to 44.4%.
- NITI multidimensional poverty: 17% → 11.28%, with 24.82 crore people estimated to have exited multidimensional poverty.
- Major gains in Uttar Pradesh, Bihar, Madhya Pradesh.
- Poverty Line
- NITI: Urban ₹1286/month | Rural ₹1059/month
- World Bank: 15/day
- Key Committees
- Alagh (1979), Lakdawala (1993), Tendulkar (2009), Rangarajan (2012)
- Legal Measures
- MGNREGA (2005), NFSA (2013), Legal Services Authorities Act (1987)
Rural Development & Social Progress Data for UPSC CSE
Rural development is closely connected with employment, infrastructure, digital governance, women’s empowerment and livelihood security. Rural development is increasingly moving beyond traditional welfare towards asset creation, digital land records, financial inclusion, self-help groups and livelihood diversification.
- Extreme poverty reduced to 3% (2022–23)(World Bank benchmark).
- Digital governance initiatives: SVAMITVA (3.29 lakh villages surveyed; 3.10 crore cards prepared; 2.65 crore distributed as of March 2026.).
- Rural infrastructure strengthened: 6% connectivity, 2.9 crore houses, 81% tap water coverage.
- Livelihood support via DAY-NRLM, DDU-GKYand SHG ecosystem (9 lakh community resource persons).
- Shift in policy: Proposal to replace MGNREGS with Viksit Bharat Rozgar framework.
Urbanisation Data for UPSC CSE
India’s urban transition is one of the most important structural changes relevant to UPSC MAINS GS Paper I and GS Paper III.
Data can strengthen answers on:
- Sustainable urbanisation
- Urban infrastructure
- Climate-resilient cities
- Waste management
- Public transport
- Urban governance
| Indicator | Value |
| Urban Pop (2011) | 31.1% |
| Projected (2031) | ~40% |
| 2050 Projection | ~814 million |
| Slum Population | ~17% |
Urban Trends
- Urban population: 410 million (2014) → 814 million (2050)
- Cities occupy <3% land but emit ~78% carbon
- Infrastructure spending: USD17/capita (vs ideal USD100)
- Most urbanised state: Goa (~62.2%)
- Namo Bharat RRTSimproving regional mobility and reducing pressure on metros.
- Waste management improved: Processing increased from 16% (2014–15) to 80% (2024–25); near-universal door-to-door collection.
Indian Polity and Governance
Centrally Sponsored Schemes (CSS)
- In 2018, the Ministry of Finance identified 131 CSSs.
- Around 15 umbrella schemes account for ~90% of total CSS allocation(Budget 2020–21).
- Rationalisation Committees:
- K. Chaturvedi Committee (2011):Suggested minimum outlay of ₹100 crore.
- Arvind Varma Committee:Proposed ₹300 crore threshold.
- With inflation, a ₹500 crore benchmarkis considered more practical today.
Development Processes & Development Industry
Non-Governmental Organizations (NGOs)
- Definition (World Bank):NGO pursuing activities to relieve suffering, protect the environment, and provide social services. They are registered under Societies Registration Act 1860.
- Status & Distribution
- India has a large NGO base: ~3 million NGOs(2009 estimate).
- ~87 lakh NGOsregistered on NGO DARPAN portal by NITI Aayog.
- State-wise concentration: Uttar Pradesh (27,270), Maharashtra (24,784), Delhi, West Bengal → ~43.7% of total.
- India has a large NGO base: ~3 million NGOs(2009 estimate).
- Globally, ~1 crore NGOs; India hosts a significant share.
- Role in Welfare & Crisis
- NGOs contributed significantly during COVID-19: ~92,000 NGOs/CSOs mobilisedfor relief and service delivery.
- Example: Akshaya Patra Foundationsupports PM POSHAN, covering ~11.8 crore children.
- Concerns
- IB Report (2014):Some foreign-funded NGOs may affect economic growth (~2–3% impact).
- As per Ministry of Home Affairs:
- ~20,693 NGO licenses cancelled; ~16,301 active.
- ~29,700 NGOs registered under FCRA 2010.
Role of Industry Associations Data for UPSC CSE
Civil society organisations and community institutions play an important role in India’s development process.
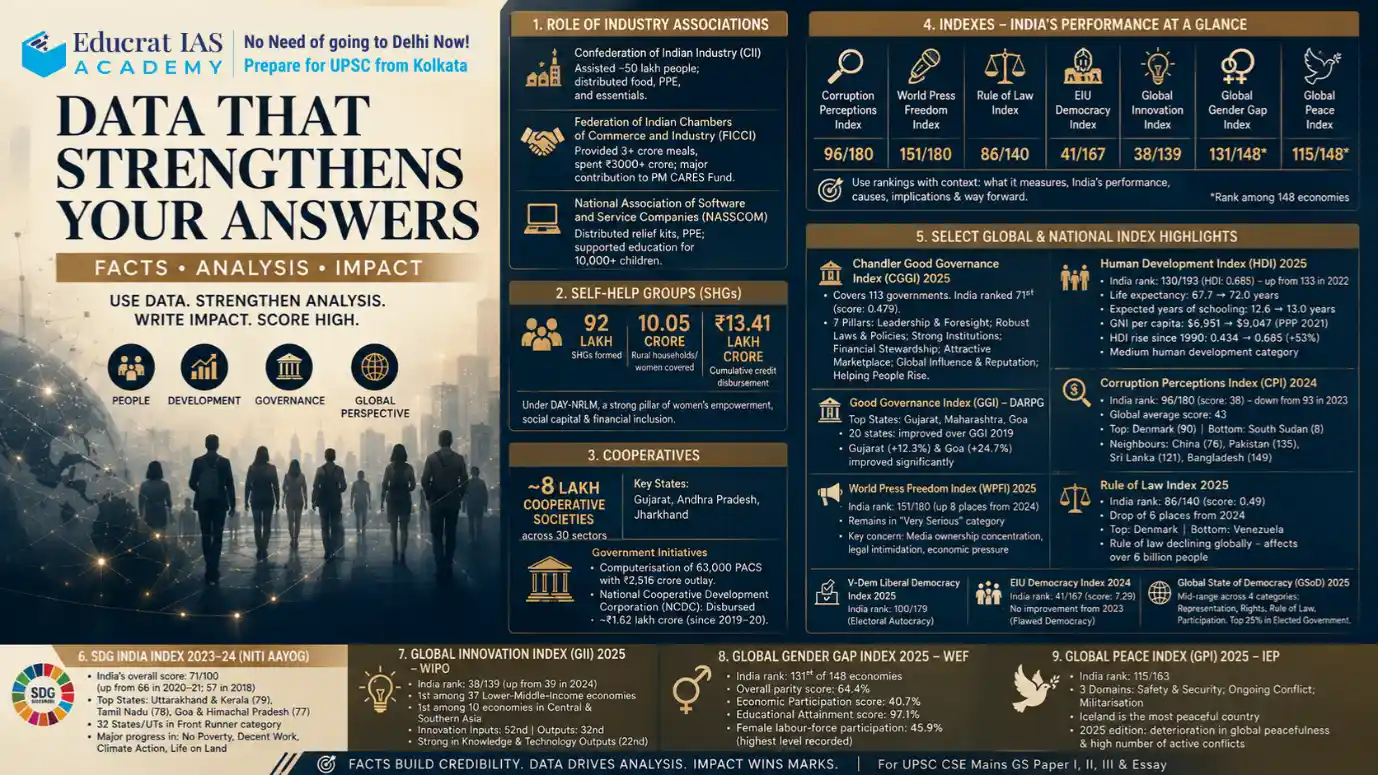
India has a large NGO ecosystem, with estimates of around 3.3 million NGOs, while approximately 1.87 lakh NGOs were registered on the NGO DARPAN portal. NGOs also played an important role during COVID-19, with around 92,000 NGOs/CSOs mobilised for relief and service delivery.
Self-Help Groups represent another major pillar of participatory development. Under DAY-NRLM, India has formed around 92 lakh SHGs, covering approximately 10.05 crore rural households/women, with cumulative credit disbursement exceeding ₹13.41 lakh crore.
Such figures are particularly useful for answers on women’s empowerment, social capital, financial inclusion, participatory development and grassroots governance.
- Confederation of Indian Industry (CII): Assisted ~50 lakh people; distributed food, PPE, and essentials.
- Federation of Indian Chambers of Commerce and Industry (FICCI): Provided 3+ crore meals, spent ₹3000+ crore; major contribution to PM CARES Fund.
- National Association of Software and Service Companies (NASSCOM): Distributed relief kits, PPE; supported education for 10,000+ children.
Self-Help Groups (SHGs) Data for UPSC CSE
- From the Ministry of Rural Development under the Deendayal Antyodaya Yojana–National Rural Livelihoods Mission (DAY-NRLM), India has formed 92 lakh (9.2 million) Self-Help Groups (SHGs), covering 05 crore (100.5 million) rural households/women, with total cumulative credit disbursement crossing ₹13.41 lakh crore.
Cooperatives Data for UPSC CSE
- ~8 lakh cooperative societiesacross 30 sectors.
- Key states: Gujarat, Andhra Pradesh, Jharkhand.
- Government Initiatives
- Computerisation of 63,000 PACSwith ₹2,516 crore outlay.
- National Cooperative Development Corporation (NCDC): Disbursed ~₹1.62 lakh crore (since 2019–20).
Indexes Data for UPSC CSE
Global indices can provide useful comparative evidence in UPSC answers. India’s performance across other major indices also provides contrasting perspectives:
- Corruption Perceptions Index: 96/180
- World Press Freedom Index: 151/180
- Rule of Law Index: 86/140
- EIU Democracy Index: 41/167
- Global Innovation Index: 38/139
- Global Gender Gap Index: 131st
- Global Peace Index: 115/163
Aspirants should avoid merely listing rankings. The better approach is to explain what the ranking measures, India’s relative performance, the underlying causes and the policy implications.
Chandler Good Government Index (CGGI)
- CGGI 2025 covers 113 governments. India ranked 71st(score: 0.479).
- Singapore topped the CGGI 2025 for the fourth time since the index launched in 2021.
- Denmark (2nd) and Norway (3rd) retained their 2024 positions.
- The top five are completed by Finland and Sweden.
- India ranked 71st in Leadership and Foresight,58th in Global Influence and Reputation, 73rd in Attractive Marketplace, and 80th in Helping People Rise.
- 7 pillars:Leadership & Foresight; Robust Laws & Policies; Strong Institutions; Financial Stewardship; Attractive Marketplace; Global Influence & Reputation; Helping People Rise
Good Governance Index (GGI) – by DARPG
- Prepared by Department of Administrative Reforms and Public Grievances (DARPG).
- Top States:Gujarat, Maharashtra, Goa (across 10 sectors).
- Gujarat (+12.3%) and Goa (+24.7%) improved significantly over GGI 2019.
- Gujarat excelled in economic governance, HR development, infrastructure, social welfare, and public safety.
- In North-East/Hill States: Mizoram (+10.4%) and Jammu & Kashmir (+3.7%) showed progress.
- Overall, 20 states improvedtheir composite scores compared to 2019.
Human Development Index (HDI) 2025
- India rank (HDR 2025):130/193 (HDI: 0.685) — up from 133 in 2022; Medium human development category.
- Life expectancy:7 → 72.0 years(highest ever recorded for India)
- Expected years of schooling:6 → 13.0 years
- GNI per capita:USD 6,951 → USD 9,047 (PPP 2021 basis)
- HDI rise since 1990:434 → 0.685 (+53%)
- Report title:“A Matter of Choice: People and Possibilities in the Age of AI”
Corruption Perceptions Index by Transparency International
- India rank (CPI 2024):96/180 (score: 38) — declined from 93 in 2023
- Global average score:43 (stagnant)
- Top (least corrupt):Denmark (90), Finland (88), Singapore (84)
- Bottom (most corrupt):South Sudan (score: 8)
- Neighbours:China (76), Pakistan (135), Sri Lanka (121), Bangladesh (149)
- Trend:India’s score has declined for 3 consecutive years (40→39→38)
World Press Freedom Index
- India rank (WPFI 2025):151/180 — improved 8 places from 159 in 2024 (was 161 in 2023)
- Top:Norway; Bottom: Eritrea
- India remains in “Very Serious” categorydespite the rank improvement
- Key concern:Media ownership concentration, legal intimidation, economic pressure on newsrooms
- Global theme:Economic fragility of journalism is the dominant threat in 2025
Rule of Law Index
- Released by World Justice Project.
- India ranked 86/140with score 49 (This reflects a drop of six places and a 1.7% decrease in score compared to 2024 assessment).
- Top:Denmark, Norway, Finland.
- Bottom:Venezuela, Cambodia, Afghanistan.
- Globally, rule of law is declining, affecting over 6 billion people.
V-Dem Liberal Democracy Index (LDI)
- India rank (V-Dem LDI 2025):100/179 (up from 104 — slight improvement in rank but remains in lower half)
- Classification:Electoral Autocracy (since 2017)
Democracy Index (EIU)
- India rank (EIU 2024):41/167 (score: 7.29) — same rank as 2023; classified as “Flawed Democracy”
- No improvement from 2023(rank held steady at 41)
- Based on:Electoral process & pluralism, functioning of government, political participation, political culture, civil liberties
Global State of Democracy (GSoD) – International IDEA
- Published by the International Institute for Democracy and Electoral Assistance (International IDEA).
- Assesses democracy through 4 broad categories: Representation; Rights; Rule of Law; and Participation.
- GSoD 2025: Focused on “Democracy on the Move” and highlighted pressures on democratic representation, participation and institutions.
- India shows mid-range performance across the four categories.
- India remains among the top 25% of countries in Elected Government, while declines have been noted in areas including access to justice, civic engagement, credible elections, free political parties and judicial independence.
- SDG India Index 2023–24 – NITI Aayog
- Prepared by NITI Aayog to measure the progress of States and UTs towards the Sustainable Development Goals.
- India’s overall score: 71/100 in 2023–24 — up from 66 in 2020–21 and 57 in 2018.
- Top States: Uttarakhand and Kerala (79), followed by Tamil Nadu (78), Goa and Himachal Pradesh (77).
- 32 States/UTs were placed in the Front Runner category.
- All States and UTs showed improvement in their overall scores.
- Major progress was recorded in No Poverty, Decent Work & Economic Growth, Climate Action and Life on Land.
- Global Innovation Index (GII) 2025 – WIPO
- Published by the World Intellectual Property Organization (WIPO) to measure innovation capabilities and outputs.
- India ranked 38th among 139 economies in GII 2025 — improving from 39th in 2024.
o India ranked 1st among 37 Lower-Middle-Income economies.
o India ranked 1st among 10 economies in Central and Southern Asia.
o Innovation Inputs: 52nd; Innovation Outputs:
o India performs particularly strongly in Knowledge & Technology Outputs (22nd). - Useful for innovation ecosystem, R&D, start-ups, technology, knowledge economy and Atmanirbhar Bharat.
- Global Gender Gap Index – World Economic Forum
- Published annually by the World Economic Forum (WEF) to measure gender parity.
- 4 dimensions: Economic Participation & Opportunity; Educational Attainment; Health & Survival; Political Empowerment.
- India ranked 131st in 2025, with an overall gender parity score of 4%.
o India’s Economic Participation & Opportunity score improved to 40.7%.
o Educational Attainment recorded a high parity score of 97.1%.
o Female labour-force participation remained at 45.9%, India’s highest level recorded in the index.
- Global Peace Index (GPI) 2025 – Institute for Economics & Peace
- Published by the Institute for Economics & Peace (IEP) and measures the relative peacefulness of countries.
- 3 broad domains: Safety & Security; Ongoing Conflict; Militarisation.
- India ranked 115th out of 163 countries in GPI 2025.
o Iceland remained the world’s most peaceful country.
o The 2025 edition recorded a continued deterioration in global peacefulness and a high number of active conflicts. - Useful for internal security, conflict, terrorism, peacebuilding, development and human security.
Parliament & Legislative Functioning Data for UPSC CSE
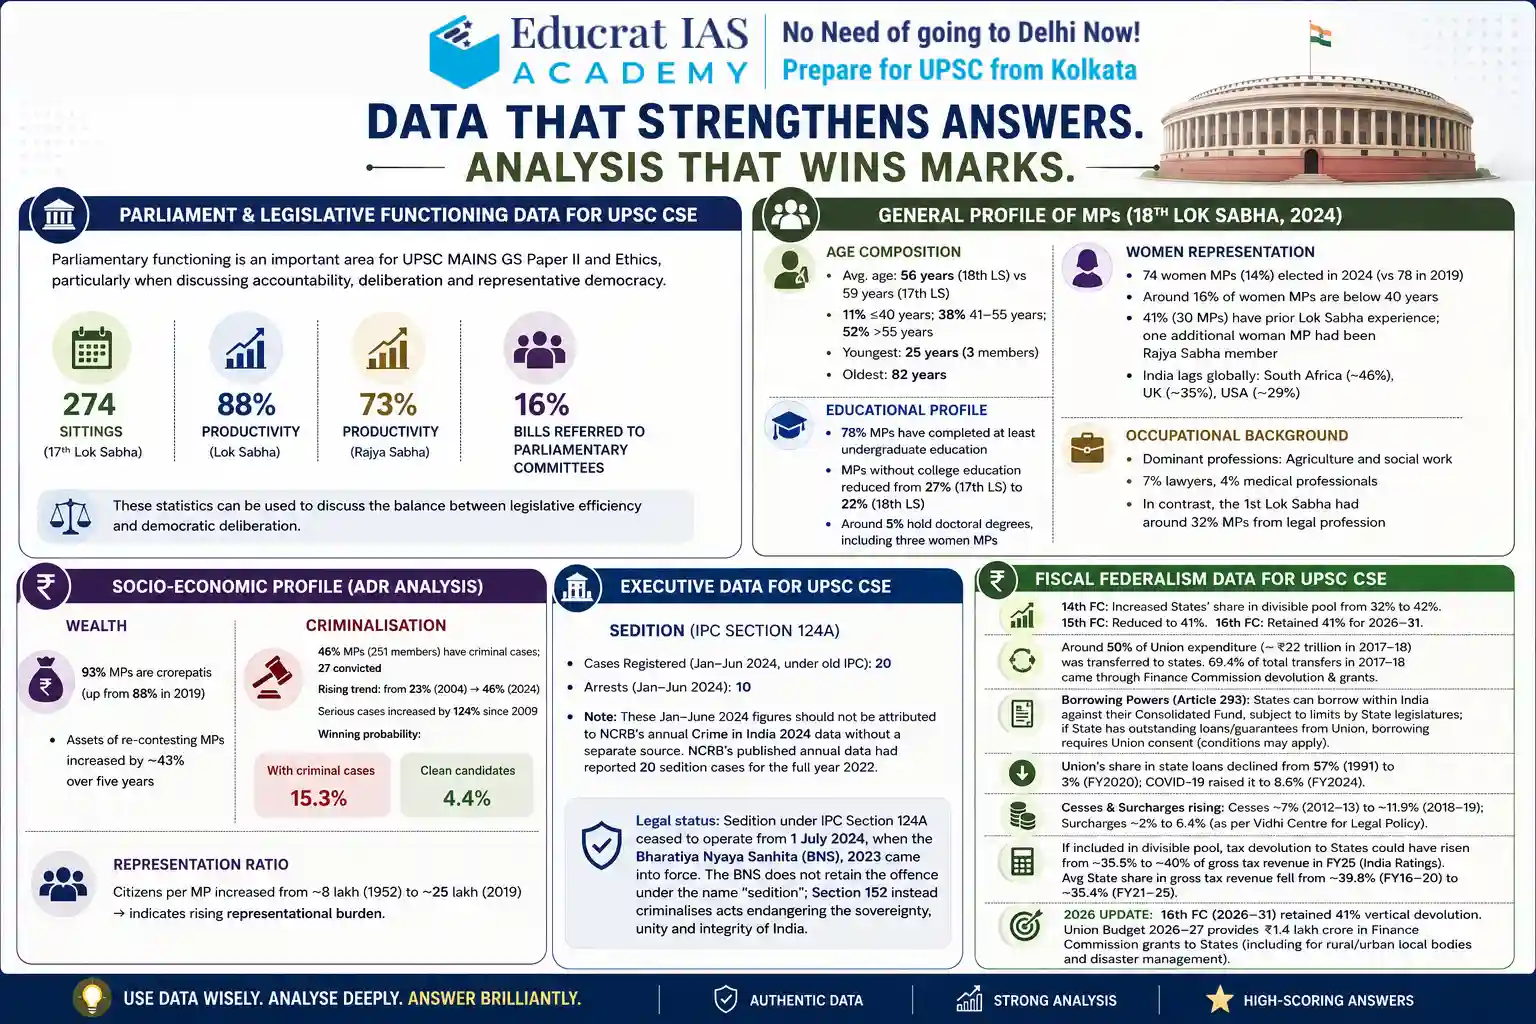
Parliamentary functioning is an important area for UPSC MAINS GS Paper II and Ethics, particularly when discussing accountability, deliberation and representative democracy. The 17th Lok Sabha had 274 sittings, while Lok Sabha productivity stood at approximately 88% and Rajya Sabha productivity at 73%. However, only 16% of Bills were referred to Parliamentary Committees, indicating concerns regarding legislative scrutiny. These statistics can be used to discuss the balance between legislative efficiency and democratic deliberation.
General Profile of MPs (18th Lok Sabha, 2024)
- As per PRS- Decline in young MPs: Share of MPs below 40 years reduced from 26% (1st LS) to 12% (17th LS) and further to 11% (18th LS).
- Age Composition:
> Average age: 56 years (18th LS) vs 59 years (17th LS).
> 11% MPs ≤40 years; 38% between 41–55 years; 52% above 55 years.
> Youngest MPs: 25 years (3 members); Oldest: 82 years. - Women Representation
> 74 women MPs (14%) elected in 2024 (slightly lower than 2019: 78 MPs).
> Around 16% of women MPs are below 40 years.
> 41% (30 MPs) have prior Lok Sabha experience; one additional woman MP had previously been a Rajya Sabha member.
> India lags globally: South Africa (~46%), UK (~35%), USA (~29%). - Educational Profile
> About 78% MPs have completed at least undergraduate education (same proportion among newly elected women MPs).
> MPs without college education reduced from 27% (17th LS) to 22% (18th LS).
> Around 5% MPs hold doctoral degrees, including three women MPs. - Occupational Background
> Dominant professions: Agriculture and social work.
> 7% lawyers, 4% medical professionals.
> In contrast, the 1st Lok Sabha had around 32% MPs from the legal profession.
Socio-Economic Profile (ADR Analysis)
- Wealth: 93% MPs are crorepatis(up from 88% in 2019).
- Assets of re-contesting MPs increased by ~43%over five years.
- Criminalisation: 46% MPs (251 members)have criminal cases; 27 convicted.
- Rising trend: from 23% (2004)→ 46% (2024).
- Serious cases increased by 124% since 2009.
- Winning probability:
- With criminal cases: 3%
- Clean candidates: 4%
- Representation Ratio: Citizens per MP increased from ~8 lakh (1952)to ~25 lakh (2019) → indicates rising representational burden.
Parliamentary Functioning (17th Lok Sabha: 2019–24)
- Sittings & Productivity
- Total sittings: 274 days(relatively low historically).
- Lowest sittings in 2020 (33 days)due to COVID-19.
- Productivity:
- Lok Sabha: 88% of scheduled time
- Rajya Sabha: 73%
- Legislative Work (Bills): 179 Bills passed(excluding financial bills).
- Finance & Home Ministries introduced highest share (15% each).
- 58% Bills passed within two weeksof introduction.
- Key Bills (e.g., J&K Reorganisation 2019, Women’s Reservation 2023) passed within 2 days.
- Limited deliberation: 35% Bills passed within <1 hour discussion (LS). Similar trend in RS (34%).
- Committee Scrutiny: Only 16% Bills referred to Parliamentary Committees(decline from earlier LS terms).
- 4 Bills examined by Joint Parliamentary Committees.
- Private Members’ Bills (PMBs): 729 PMBs introduced in Lok Sabha, but only 2 discussed.
- In Rajya Sabha: 705 introduced, 14 discussed.
- Historically, only 14 PMBs passed, none after 1970.
- Parliamentary Discussions: Around 31% (LS)and 32% (RS) time spent on non-legislative discussions.
- Question Hour functioning:
- Lok Sabha: 60% of scheduled time
- Rajya Sabha: 52%
- Budget Scrutiny:
- Average discussion time: ~35 hoursin Lok Sabha.
- ~80% of budget passed without discussion (2019–23).
- Entire budget passed without debate in 2023(also seen in 2018 & 2013).
- Latest Budget Session 2026:
o Lok Sabha spent about 35 hours discussing the Union Budget and expenditure of two ministries.
o Budgets of five ministries were listed for discussion, but only Agriculture and Railways were actually discussed.
o 77% of the budget was guillotined, i.e. passed without discussion.
o On 12 days, less than 15 minutes were spent on Question Hour in Lok Sabha.
o No Private Members’ Business was conducted in Lok Sabha during the 2026 Budget Session.
Executive Data for UPSC CSE
Sedition (IPC Section 124A)
- Cases Registered (Jan–Jun 2024, under old IPC): 20
- Arrests (Jan–Jun 2024): 10
- Note: These Jan–June 2024 figures should not be attributed to NCRB’s annual Crime in India 2024 data without a separate source. NCRB’s published annual data had reported 20 sedition cases for the full year 2022.
- Legal status: Sedition under IPC Section 124A ceased to operate from 1 July 2024, when the Bharatiya Nyaya Sanhita (BNS), 2023 came into force. The BNS does not retain the offence under the name “sedition”; Section 152 instead criminalises acts endangering the sovereignty, unity and integrity of India.
Fiscal Federalism Data for UPSC CSE
Fiscal federalism is a recurring theme in UPSC CSE MAINS GS Paper II.
The 14th Finance Commission increased States’ share in the divisible pool from 32% to 42%, while the 15th Finance Commission reduced it to 41%. The 16th Finance Commission has retained the 41% vertical devolution for 2026–31.
However, the effective fiscal space available to States is influenced by the growing role of cesses and surcharges, which are excluded from the divisible pool.
This provides an excellent example of how an answer can move beyond stating constitutional provisions and analyse the practical dimensions of cooperative and competitive federalism.
- As per RBI and budget data: Around 50% of Union expenditure (~₹22 trillion in 2017–18)was transferred to states.
- 4% of total Union transfers in 2017–18 came through Finance Commission devolution and grants; much of the remainder was through Centrally Sponsored Schemes and other non-FC transfers.
- Borrowing Powers (Article 293): States can borrow within India against their Consolidated Fund, subject to limits prescribed by State legislatures; however, where a State has outstanding loans or guarantees from the Union, its borrowing requires the consent of the Union Government, which may impose conditions.
- Changing borrowing pattern: Union’s share in state loans declined sharply from 57% (1991)to 3% (FY2020).
- COVID-19 reversed this trend temporarily, increasing it to 6% (FY2024)due to fiscal stress.
- Finance Commission Trends: The 14th Finance Commission raised States’ share in the divisible pool of Union taxes from 32% to 42% for 2015–20.
- The 15th Finance Commission reduced this to 41% for 2021–26, primarily to account for the creation of the Union Territories of Jammu & Kashmir and Ladakh.
- The 16th Finance Commission has retained the States’ share at 41% for 2026–31, and the Union Government accepted this recommendation in Budget 2026–27.
- However, rising cesses and surcharges — which are excluded from the divisible pool — reduce the effective share of gross tax revenue accruing to States.
- As per Vidhi Centre for Legal Polic, Share of cesses increased from ~7% (2012-13)to ~11.9% (2018-19); surcharges from ~2% to 6.4%.
- According to India Ratings and Research:
- If cesses and surcharges were included in the divisible pool, tax devolution to States could have risen from ~35.5% to ~40% of gross tax revenue in FY25.
- The FY25 Budget Estimate provided for States to receive around 5% of gross tax revenue, below the 41% of the divisible pool recommended by the 15th Finance Commission.
- Average State share in gross tax revenue declined from ~39.8% (FY16–20) to ~35.4% (FY21–25).
- 2026 update: The 16th Finance Commission (2026–31) has retained vertical devolution at 41% of the divisible pool. The Union Budget 2026–27 provides ₹1.4 lakh crore in Finance Commission grants to States, including grants for rural and urban local bodies and disaster management.
Judiciary Data for UPSC CSE
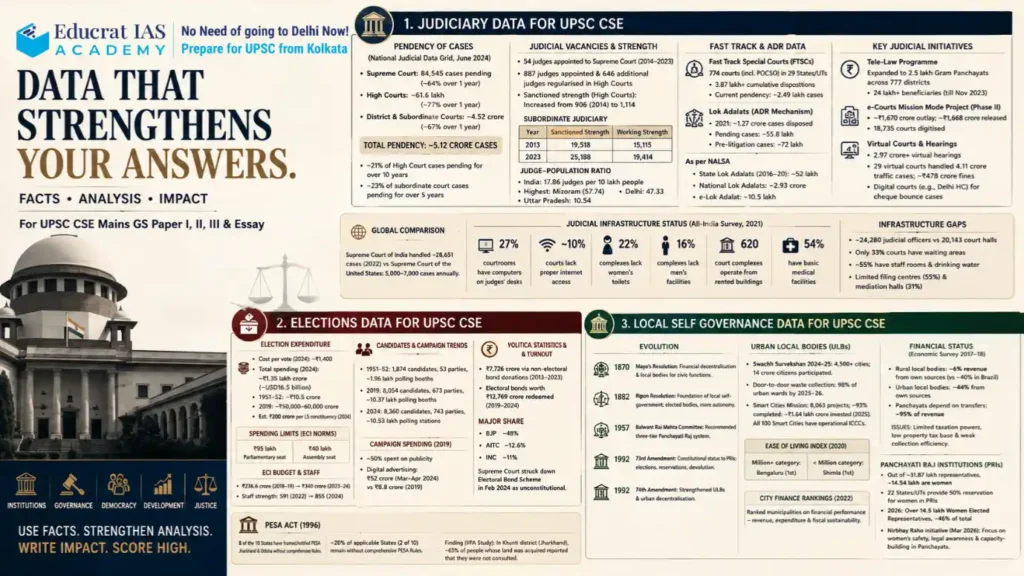
Judicial pendency remains one of India’s major governance challenges. According to the data, approximately 5.12 crore cases were pending across the Supreme Court, High Courts and district/subordinate courts in the cited 2024 data. The latest references continue to place overall pendency above 5 crore cases. The data also highlights infrastructure and human-resource constraints, including shortages of judicial officers, courtrooms and basic facilities. At the same time, initiatives such as e-Courts, Tele-Law, Virtual Courts, Lok Adalats and Fast Track Special Courts seek to improve access to justice.
This allows UPSC aspirants to frame balanced answers covering both institutional weaknesses and reform initiatives.
Pendency of Cases
- As per National Judicial Data Grid (June 2024):
- Supreme Court:84,545 cases pending (~64% over 1 year)
- High Courts:~61.6 lakh (~77% over 1 year)
- District & Subordinate Courts:~4.52 crore (~67% over 1 year)
- Total pendency:~5.12 crore cases
- The latest 2026 government references continue to place overall judicial pendency at over 5 crore cases, although the exact figure changes continuously with fresh filings and disposals.
- Long-term pendency:
- ~21% of High Court cases pending for over 10 years
- ~23% of subordinate court cases pending for over 5 years
Judicial Vacancies & Strength
- As per Ministry of Law and Justice: 54 judgesappointed to the Supreme Court (2014–2023)
- 887 judges appointedand 646 additional judges regularised in High Courts
- Sanctioned strength (High Courts): Increased from 906 (2014)to 1,114
- Subordinate judiciary:
| Year | Sanctioned Strength | Working Strength |
| 2013 | 19,518 | 15,115 |
| 2023 | 25,188 | 19,414 |
- Judge-population ratio:
- India: 86 judges per 10 lakh people
- Highest: Mizoram (57.74)
- Delhi: 33
- Uttar Pradesh: 54
Fast Track & Alternative Dispute Resolution Data for UPSC CSE
- Fast Track Special Courts (FTSCs): 774 courts(including POCSO courts) functional across 29 States/UTs
- The scheme has recorded 87 lakh+ cumulative disposals since inception.
- Current pendency in FTSCs including exclusive POCSO courts: ~2.49 lakh cases.
- Lok Adalats (ADR mechanism): In 2021, ~1.27 crore cases disposedin National Lok Adalats
- Pending cases:~55.8 lakh
- Pre-litigation cases:~72 lakh
- As per National Legal Services Authority (NALSA):
- State Lok Adalats (2016–20):~52 lakh cases disposed
- National Lok Adalats:~2.93 crore cases disposed
- e-Lok Adalat:~10.5 lakh cases resolved
Key Judicial Initiatives
- Tele-Law Programme: Expanded to 5 lakh Gram Panchayats across 777 districts
- Over 24 lakh beneficiariesreceived legal advice (till Nov 2023)
- e-Courts Mission Mode Project (Phase II): ~₹1,670 crore outlay; ~₹1,668 crore released
- 18,735 courts digitised
- Virtual Courts & Hearings: 2.97 crore+ virtual hearingsconducted since COVID period
- 29 virtual courtshandled 11 crore traffic cases, collecting ~₹478 crore in fines
- Digital courts (e.g., Delhi HC) set up for cheque bounce cases
Global Comparison
- As per Supreme Court Observer: Supreme Court of Indiahandled ~28,651 cases (2022)
- Supreme Court of the United Statesdeals with only 5,000–7,000 cases annually.
Judicial Infrastructure Status
- Based on All-India survey (2021): Only 27% courtroomshave computers on judges’ desks
- ~10% courts lack proper internet access
- 22% complexes lack women’s toilets, 16% lack men’s facilities
- 620 court complexesoperate from rented buildings
- Only 54% have basic medical facilities
- Infrastructure gaps: ~24,280 judicial officers vs 20,143 court halls
- Only 33% courts have waiting areas
- ~55% have staff rooms and drinking water
- Limited availability of filing centres (55%) and mediation halls (31%)
Elections Data for UPSC CSE
Election Expenditure
- As per Centre for Media Studies (CMS): Cost per vote (2024):~₹1,400
- Total election spending (2024):~₹1.35 lakh crore (~USD16.5 billion), exceeding the 2020 United States Elections expenditure (~₹1.2 lakh crore)
- Rising trend:
- 1951–52 elections: ~₹10.5 crore
- 2019 elections: ~ ₹50,000–60,000 crore
- Estimated ₹200 crore per Lok Sabha constituency (2024)
- Spending limits (ECI norms):
- ₹95 lakh (Parliamentary seat)
- ₹40 lakh (Assembly seat)
- Election Commission budget:
- Increased from ₹236.6 crore (2018–19)to ₹340 crore (2023–24)
- Staff strength rose from 591 (2022)to 855 (2024)
Number of Candidates & Campaign Trends
- As per Association for Democratic Reforms (ADR):
- 1951–52 elections:1,874 candidates, 53 parties, ~1.96 lakh polling booths
- 2019 elections:8,054 candidates, 673 parties, ~10.37 lakh polling booths
- 2024 elections: 8,360 candidates, 743 parties, ~10.53 lakh polling stations
- Campaign spending pattern (2019):
- ~50% spent on publicity
- Sharp rise in digital advertising: ₹52 crore (Mar–Apr 2024) vs ₹8.8 crore (2019)
Political Funding
- As per Election Commission of India (ECI):
- ₹7,726 crore received via non-electoral bond donations (2013–2023)
- Electoral bonds worth ₹12,769 croreredeemed (2019–2024)
- Major share:
- Bharatiya Janata Party:~48%
- All India Trinamool Congress:~12.6%
- Indian National Congress:~11%
- The Supreme Court struck down the Electoral Bond Scheme in February 2024, holding the scheme unconstitutional; SBI was directed to disclose bond-related information to the ECI.
Voter Statistics & Turnout
- As per Election Commission of India:
- Total voters (2024):~96.88 crore
- Elector Gender ratio:Improved from 940 (2023) to 948 (2024)
- Voter turnout (2024 Lok Sabha):
- ~64.2 crore voters (~66%)
- Women participation: ~31.2 crore
- The number of voters participating in India’s 2024 election was around 5 times the combined electorate of the G7 countries.PESA Act (1996)
- Applicable in Fifth Schedule Areas, but:
- 8 of the 10 States with Fifth Schedule Areas have framed/notified PESA Rules; Jharkhand and Odisha remained without comprehensive PESA Rules in the cited assessment.
- ~20% of applicable States (2 of 10) remained without comprehensive PESA Rules.Findings (study by Indian Institute of Public Administration):
- Weak implementation; e.g., in Jharkhand’s Khunti district, ~65% of people whose land was acquired reported that they were not consulted during land acquisition.
Local Self Governance Data for UPSC CSE
Decentralisation is central to India’s democratic architecture. The 73rd and 74th Constitutional Amendments provided constitutional recognition to Panchayati Raj Institutions and Urban Local Bodies respectively. However, fiscal autonomy remains a major challenge. Panchayats depend heavily on transfers, with rural local bodies generating only around 6% of their revenue internally according to the cited Economic Survey data.
Evolution
- Colonial Period
- Mayo’s Resolution (1870):Introduced financial decentralisation and encouraged local bodies to manage civic functions.
- Ripon Resolution (1882): Considered the foundation of local self-government in India; promoted elected local bodies and greater autonomy.
- Post-Independence Developments
- Balwant Rai Mehta Committee (1957):Recommended the three-tier Panchayati Raj system (village, block, district) to promote democratic decentralisation.
- Constitutional Recognition
- 73rd Constitutional Amendment Act (1992):Gave constitutional status to Panchayati Raj Institutions (PRIs), ensuring regular elections, reservations, and devolution of powers.
- 74th Constitutional Amendment Act (1992):Strengthened Urban Local Bodies (ULBs) by institutionalising urban governance and decentralisation.
Urban Local Bodies (ULBs)
- Swachh Survekshan 2024–25: Assessment covered 4,500+ cities, with 14 crore citizens participating.
- Door-to-door collection of municipal solid waste reached 98% of urban wards by 2025–26.
- Smart Cities Mission (SCM):
- 8,063 projects under the Smart Cities Mission, with ~93% completed and ~₹1.64 lakh crore invested as of 2025.
- o All 100 Smart Cities have operational Integrated Command and Control Centres (ICCCs).
- Ease of Living Index (2020):
- Million+ category: Bengalururanked first
- Less than million category: Shimlaranked first
- City Finance Rankings (2022):
- Assessed and ranked municipalities on their financial performance, including revenue mobilisation, expenditure management and fiscal sustainability.Financial Status of Local Bodies
- As per Economic Survey of India 2017-18:
- Rural local bodies generate only ~6% of revenue internally(vs ~40% in Brazil)
- Urban local bodies generate ~44% from own sources
- Panchayats depend heavily on transfers (~95% of revenue)
- Issues: Limited taxation powers
- Low property tax base and weak collection efficiency
Panchayati Raj Institutions (PRIs)
- Women’s Participation (PRI Report): Out of ~31.87 lakh representatives, ~14.54 lakh are women
- 22 States/UTsprovide 50% reservation for women in PRIs
- 2026: Over 5 lakh Women Elected Representatives serve in PRIs, constituting around 46% of total elected representatives. The Nirbhay Raho initiative, launched in March 2026, focuses on women’s safety, legal awareness and capacity-building in Panchayats.
E-GOVERNANCE Data for UPSC CSE
Global Status (UNDESA – EGDI 2022)
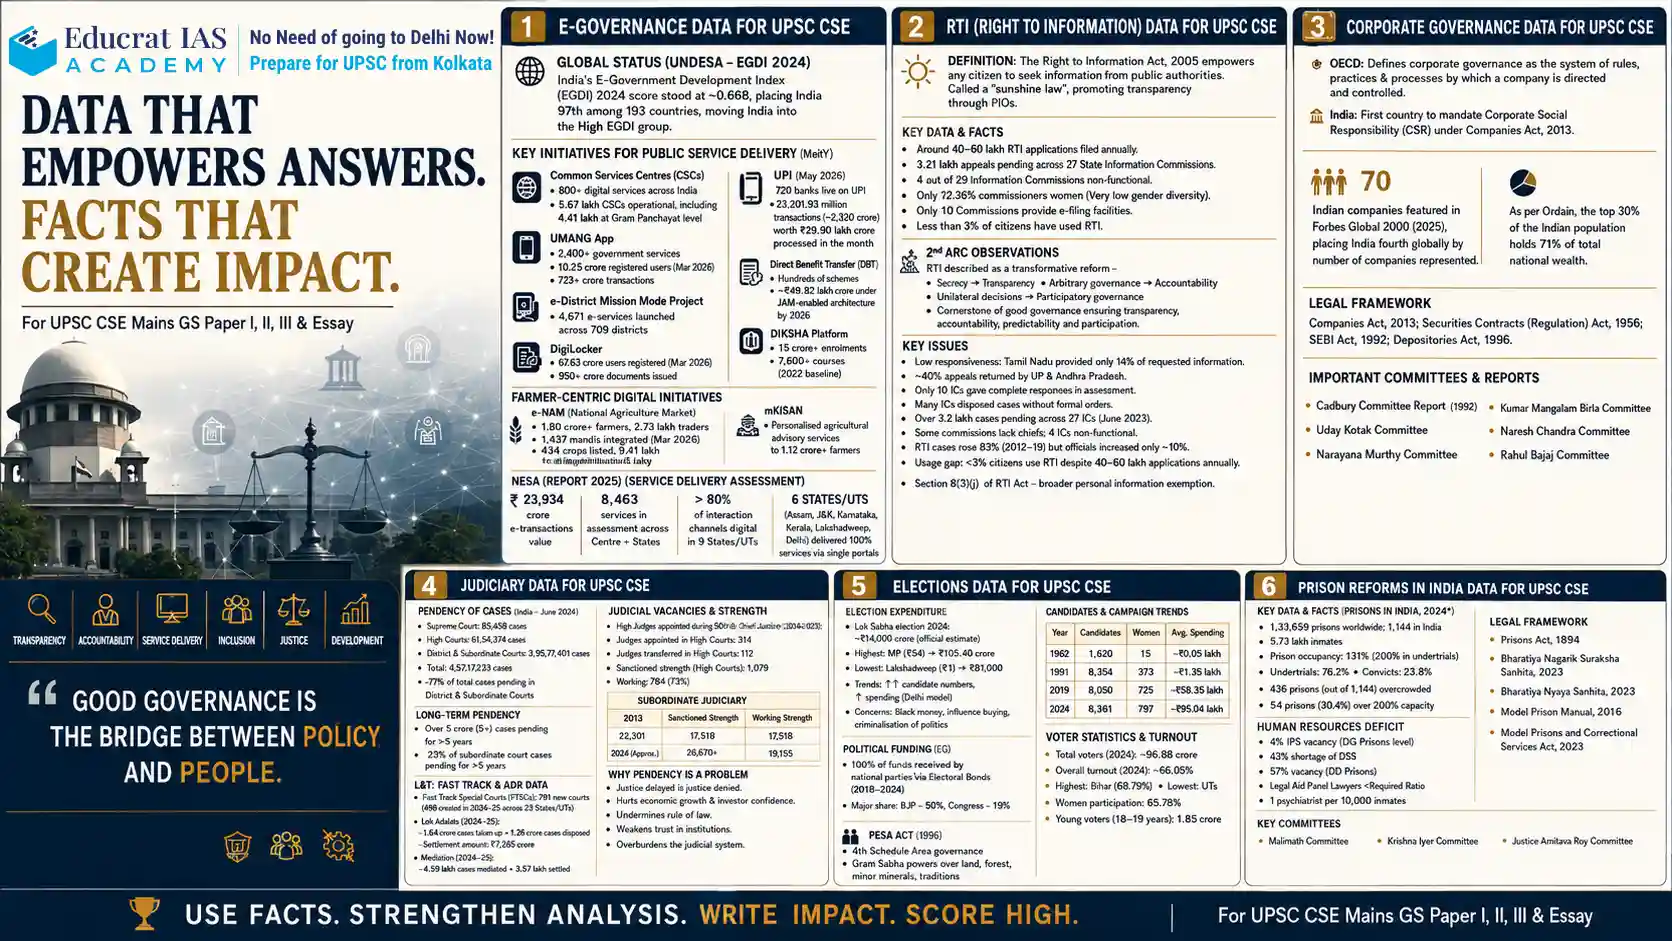
- India’s E-Government Development Index (EGDI) 2024 score stood at ~0.668, placing it 97th among 193 countries, moving India into the High EGDI
Key Initiatives for Public Service Delivery (MeitY)
- Common Services Centres (CSCs):
- Provide 800+ digital services
- Around 67 lakh CSCs operational, including 4.41 lakh at Gram Panchayat level, ensuring last-mile connectivity.
- UMANG (Unified Mobile Application for New-age Governance):
- Offers 2,400+ government services; as of March 2026, UMANG had 25 crore registered users and 723+ crore transactions.
- e-District Mission Mode Project: 4,671 e-serviceslaunched across 709 districts, enhancing district-level service delivery.
- DigiLocker: As of March 2026, 63 crore users had registered, with 950+ crore documents issued.
- UPI (Unified Payments Interface): As of May 2026, 720 banks were live on UPI, with 23,201.93 million transactions (~2,320 crore) worth ₹29.90 lakh crore processed in the month.
- Direct Benefit Transfer (DBT):
- DBT has expanded to hundreds of schemes across Union ministries, with cumulative transfers reaching ~₹49.82 lakh crore under the JAM-enabled architecture by 2026.
- DIKSHA Platform:
- The platform has crossed 15 crore enrolments and hosts 7,600+ courses in the officially reported benchmark; retain these as a 2022 baseline, rather than a current 2026 figure.
Farmer-Centric Digital Initiatives
- e-NAM (National Agriculture Market):
- As of March 2026, 80 crore+ farmers, 2.72 lakh traders and 4,724 FPOs were registered on e-NAM.
- 1,656 mandis integrated across 23 States and 4 UTs.
- m-KISAN:
- Provides personalised agricultural advisories through SMS, tailored to farmers’ language, location and agricultural practices.
NeSDA Report 2025 (Service Delivery Assessment)
- 23,934 e-services were being offered across States/UTs in November 2025.
- Local Governance & Utility Services accounted for 8,463 services, the largest sector.
- Saturation of the 59 mandatory e-services exceeded 80% nationally, with 21 States/UTs achieving more than 90% saturation.
- Unified portals: Assam, J&K, Karnataka, Odisha, Uttarakhand and Kerala achieved 100% service delivery through a single unified portal.
RTI (Right to Information) Data for UPSC CSE
- Definition: The Right to Information Act, 2005 empowers any Indian citizen to seek information from public authorities.
- It is often termed a “sunshine law”as it promotes transparency in governance.
- RTI applications are processed by designated Public Information Officers (PIOs).
- Data/Facts: Around 14 lakh appealsare pending across 29 State Information Commissions.
- 2 out of 29 Information Commissions were completely defunct as of October 7, 2025; six commissions were non-functional for varying periods during July 2024–October 2025.
- Women have constituted 10% of Information Commissioners since the RTI Act came into force; only 6% of Chief Information Commissioners have been women.
- Only 11 of 29 Information Commissions provided e-filing facilities in the earlier assessment; this should be treated as a historical digitisation benchmark, not a current 2026 figure.
- 2nd ARC Observations:
- The Second Administrative Reforms Commission described RTI as a transformative reform, marking a shift:
- From secrecy → transparency
- From arbitrary governance → accountability
- From unilateral decisions → participatory governance
- It emphasized RTI as a cornerstone of good governance, ensuring transparency, accountability, predictability, and participation.
- The Second Administrative Reforms Commission described RTI as a transformative reform, marking a shift:
- Key Issues
- Low responsiveness:Tamil Nadu provided only 14% of the requested information.
- Only 10 Information Commissions (ICs)gave complete responses in assessment.
- In the 2022–23 assessment, Uttar Pradesh, Andhra Pradesh and several other Information Commissions returned a substantial proportion of appeals/complaints without passing orders.
- Many ICs disposed cases without formal orders, indicating weak accountability.
- Pending backlog 4,13,972 appeals and complaints across 29 Information Commissions as of June 30, 2025.
- Institutional gaps: Some commissions lack chiefs; a few are non-functional.
- Usage gap:The latest SNS assessment notes nearly 60 lakh RTI applications annually; Information Commissions receive appeals/complaints in only about 5% of RTI applications.
- Digital Personal Data Protection Act, 2023: The DPDP framework operationalised in 2025 amended Section 8(1)(j) of the RTI Act, broadening the personal-information exemption and deleting the earlier proviso concerning information that could not be denied to Parliament/State Legislatures.
Corporate Governance Data for UPSC CSE
- OECD:Defines corporate governance as the system of rules, practices, and processes by which a company is directed and controlled.
- India:Became the first country to mandate Corporate Social Responsibility (CSR) under the Companies Act, 2013.
- Key Facts: 70 Indian companies featured in the Forbes Global 2000 (2025) rankings, placing India fourth globally by number of companies represented.
- As per Oxfam, the top 10% of the Indian population holds 77% of the total national wealth, highlighting governance and equity concerns.
- Legal Framework: Companies Act, 2013, Securities Contracts (Regulation) Act, 1956, SEBI Act, 1992, Depositories Act, 1996
- Important Committees & Reports: Cadbury Committee Report; UNCTAD(2006 guidelines); Uday Kotak Committee; Kumar Mangalam Birla Committee; Narayana Murthy Committee; Naresh Chandra Committee; Rahul Bajaj Committee
Prison Reforms in India Data for UPSC CSE
- Key Data & Facts (as per Prison in India, 2024)
- Overcrowded Prisons:1,333 prisons with a sanctioned capacity of 53 lakh (housed over 5.11 lakh inmates).
- Occupancy Rate~ 7% in 2024, the lowest national occupancy rate in a decade, but still indicating significant overcrowding. ( Historical peak: 131.4% in 2022.)
- More than 50% of the States/UTs recorded occupancy rates above 100%.
- Delhi – highest occupancy rate (194.6%), followed by Meghalaya (163.5%), Jammu & Kashmir (148.3%), and Madhya Pradesh (147.1%).
- Increased Prison capacity: 24% (2015-2024).
- Undertrial prisoners constituted about 72.6%of the total prison population.
- “Nearly 3 out of every 4 prisoners are undertrials”
- Convict Share:6% in 2024.
- Delhi and Bihar recorded among the highest shares of undertrial prisoners, with over 87% of inmates being undertrials.
- Prolonged Detention:While most undertrials were detained for less than a year, 9,028 prisoners (2.4%) remained in jail for over five years without conviction.
- 4% (1,77,400 prisoners)cited as SC/ST combined.
- Human Resources Deficit:
- Prison Administration (Correctional Staff): 44.1% vacancy (2022)
- Forensic Infrastructure (State Forensic Science Laboratory Staff): 52% vacancy (2023)
- Legal Aid (Panel Lawyer-Prisoner Ratio): 1 lawyer per 13 prisoners (2023)
- Legal Framework
- Bharatiya Nyaya Sanhita, 2023
- Bharatiya Nagarik Suraksha Sanhita, 2023
- Bharatiya Sakshya Adhiniyam, 2023
- Model Prisons and Correctional Services Act, 2023 — provides a modern framework for prison administration, correctional services, rehabilitation and reintegration.
- Key Committees: Justice A.N. Mulla Committee; Krishna Iyer Committee; Justice Amitava Roy Committee
Final Reminder for UPSC Aspirants
Preparing for UPSC Mains is not about memorising hundreds of statistics but about knowing when and how to use the most relevant ones effectively. Focus on revising the frequently used data points and incorporate them naturally into your answers to strengthen your arguments. As government reports and surveys are released periodically, make it a habit to revisit this page and update your notes with the latest information. In every GS Mains answer, try to include at least one authentic statistic, one relevant government scheme or committee recommendation, and one practical way forward to make your response balanced, evidence-based, and analytical. Always remember that official data should support your argument rather than dominate it—accuracy, relevance, and proper application are far more valuable than quoting numerous figures. Bookmark this page for regular revision, as it will be updated with the latest facts and statistics relevant for UPSC CSE Mains 2026. A well-structured answer backed by authentic government data is often what distinguishes a good answer from an excellent one.

Turn Data into Analysis
Data becomes useful in UPSC Mains only when it is converted into an argument. A statistic on judicial pendency should lead to a discussion on access to justice; migration figures should help explain the challenges of portability, social security and urbanisation; parliamentary data can strengthen an argument on legislative scrutiny; and e-governance figures can demonstrate both the progress and limitations of digital public service delivery.
Therefore, use this data bank as an answer-enrichment tool, not a catalogue for rote memorisation. Prioritise recent and credible figures, connect data with constitutional values and government initiatives, and always explain what the numbers reveal. A well-placed statistic, when combined with a clear argument and a relevant example, can transform a generic UPSC answer into a precise, evidence-based and analytical response. The ultimate goal is simple: less data dumping, more data-driven analysis.