UPSC Mains 2026 Data Bank: Latest Facts, Statistics & Government Data for Answer Writing
Securing a top rank in UPSC Mains 2026 requires more than conceptual clarity—it demands data-backed answers, official statistics, and current affairs-based evidence. The highest-scoring UPSC Mains answers are supported by government reports, committee recommendations, survey findings, and authentic data.
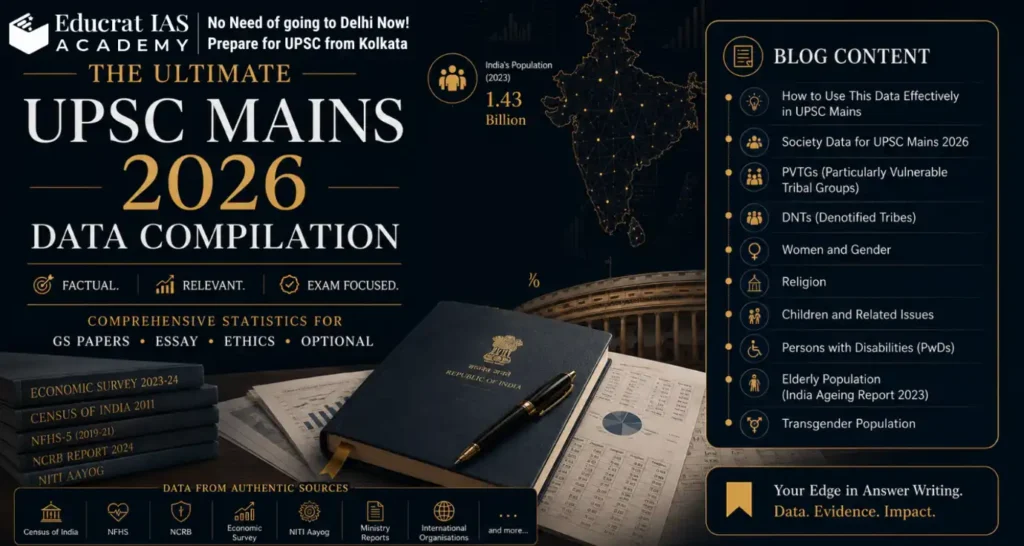
This UPSC Mains 2026 Data Bank is a one-stop repository of the latest facts, figures, and government statistics for GS Papers I-IV, Essay, Ethics, and Optional subjects. Compiled from authentic sources such as the Economic Survey, Census, NFHS, NCRB, NITI Aayog, Ministry reports, and international organisations, it covers every major theme relevant to the UPSC syllabus.
At Educrat IAS Academy, one of the leading UPSC coaching institutes in Kolkata, we believe in going the extra mile to simplify preparation and save aspirants countless hours of research. Rather than searching through dozens of reports and government publications, you can find all the high-value statistics needed for UPSC Mains in one comprehensive resource.
This blog contains carefully curated data on Indian Society, Women, Tribes, Religion, Children, Persons with Disabilities, Elderly Population, Transgender Persons, Governance, Economy, Environment, Science & Technology, Internal Security, International Relations, Agriculture, and Sustainable Development. Each section is designed to help you write fact-rich, analytical, and high-scoring answers.
Bookmark this page and revisit it regularly while preparing for UPSC Mains 2026. These statistics will strengthen your arguments, improve answer quality, and give your copies the factual edge that UPSC examiners appreciate.
Blog Content:
- How to Use This Data Effectively in UPSC Mains
- Society Data for UPSC Mains 2026
- Salient Features of Indian Society
- India as a Multilingual Society
- Caste Structure
- Tribal Population and Distribution
- Education
- Health
- Employment and Skill Development
- Constitutional and Legal Safeguards
- Major Government Schemes and Institutions
- Important Committees and Commissions
- PVTGs (Particularly Vulnerable Tribal Groups)
- DNTs (Denotified Tribes)
- Women and Gender
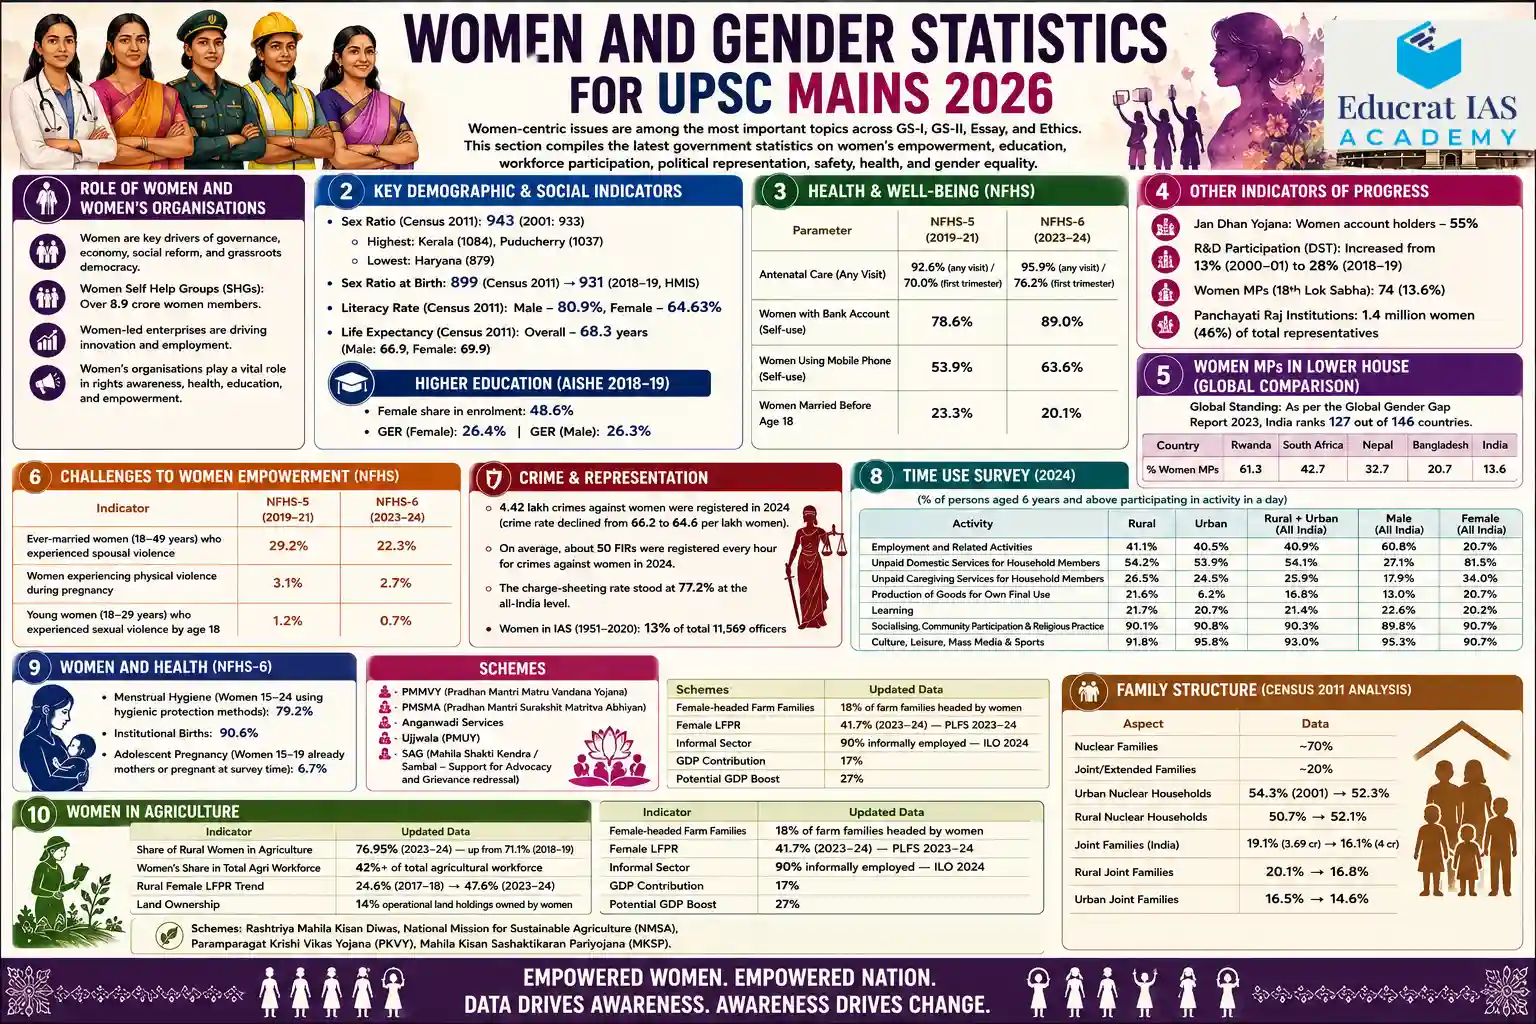
- Role of Women and Women’s Organisations
- Key Demographic & Social Indicators
- Higher Education (AISHE 2018–19)
- Women MPs in Lower House (Global Comparison)
- Challenges to Women Empowerment
- Crime & Representation
- Time Use Survey (2024)
- Women and Health (NFHS-6)
- Women in Agriculture
- Family Structure (Census 2011 Analysis)
- Religion
- Religion-Induced Violence (NCRB 2024)
- Religion and Fertility Rate (NFHS-4 vs NFHS-5)
- Religious Diversity
- Children and Related Issues
- Child Demographics & Vulnerability
- Child Labour
- Children’s Education (UDISE+ FY22)
- Child Malnutrition & Hunger
- Child Mortality & Hunger Context
- Sex Ratio at Birth
- Juvenile Delinquency
- Child Trafficking
- Child Marriage
- Cyber Crimes Against Children (NCRB 2024)
- Persons with Disabilities (PwDs)
- Prevalence (Different Estimates):
- Education (Children with Disabilities)
- State-wise Concentration of PwDs
- Elderly Population (India Ageing Report 2023)
- Transgender Population
- Demography
- Socio-Economic Status
- Population & Demographic Dividend
- Legal/Policy Framework
- Demographic Dividend
- Final Reminder for UPSC Aspirants
How to Use This Data Effectively
This data compilation is designed to help you enrich your UPSC Mains answers with authentic, evidence-based facts—not to memorise every statistic. It is neither practical nor necessary to remember every figure presented in this blog. Instead, read through each section carefully and identify 3–4 high-impact statistics that you find easy to remember. These could be unique percentages, rankings, trends, or government data that naturally fit into multiple topics. Since everyone retains information differently, choose the facts that are most memorable to you and revise them consistently.
Remember, UPSC Mains is not about quoting dozens of statistics in every answer; it is about using a few relevant and authentic data points at the right place to strengthen your arguments. While writing answers on topics such as women’s empowerment, tribal development, social justice, governance, demographic dividend, or inclusive growth, combine one or two official statistics with a relevant government scheme, constitutional provision, committee recommendation, or practical way forward. This makes your answers more analytical, balanced, and evidence-based.
Use these statistics naturally to support your analysis rather than listing them mechanically. Revisit this page regularly as new government reports and surveys are released, and update your notes accordingly. By mastering a carefully selected set of memorable facts instead of attempting to memorise everything, you will be able to recall them confidently in the examination hall and present stronger, high-scoring UPSC Mains answers.
Society Data for UPSC Mains 2026
Indian Society is one of the most important themes in UPSC CSE Mains, especially in GS Paper I, GS Paper II, Essay, and Ethics. Questions on social issues demand more than theoretical knowledge—they require relevant facts, official statistics, and government data to support your arguments.
This section compiles the latest UPSC-ready statistics on demographics, women, transgender persons, religion, children, elderly population, education, poverty, social justice, health, and inequality from authentic government reports and national surveys. These data points will help you write evidence-based answers, improve answer credibility, and fetch higher marks.
Whether you are writing about women’s empowerment, demographic dividend, ageing population, child welfare, social inclusion, gender equality, or vulnerable sections, these updated figures will enable you to enrich your answers with accurate and impactful evidence. Use this dataset as a quick revision resource and incorporate these statistics naturally into your UPSC Mains answer writing to make your responses more analytical, balanced, and scoring.
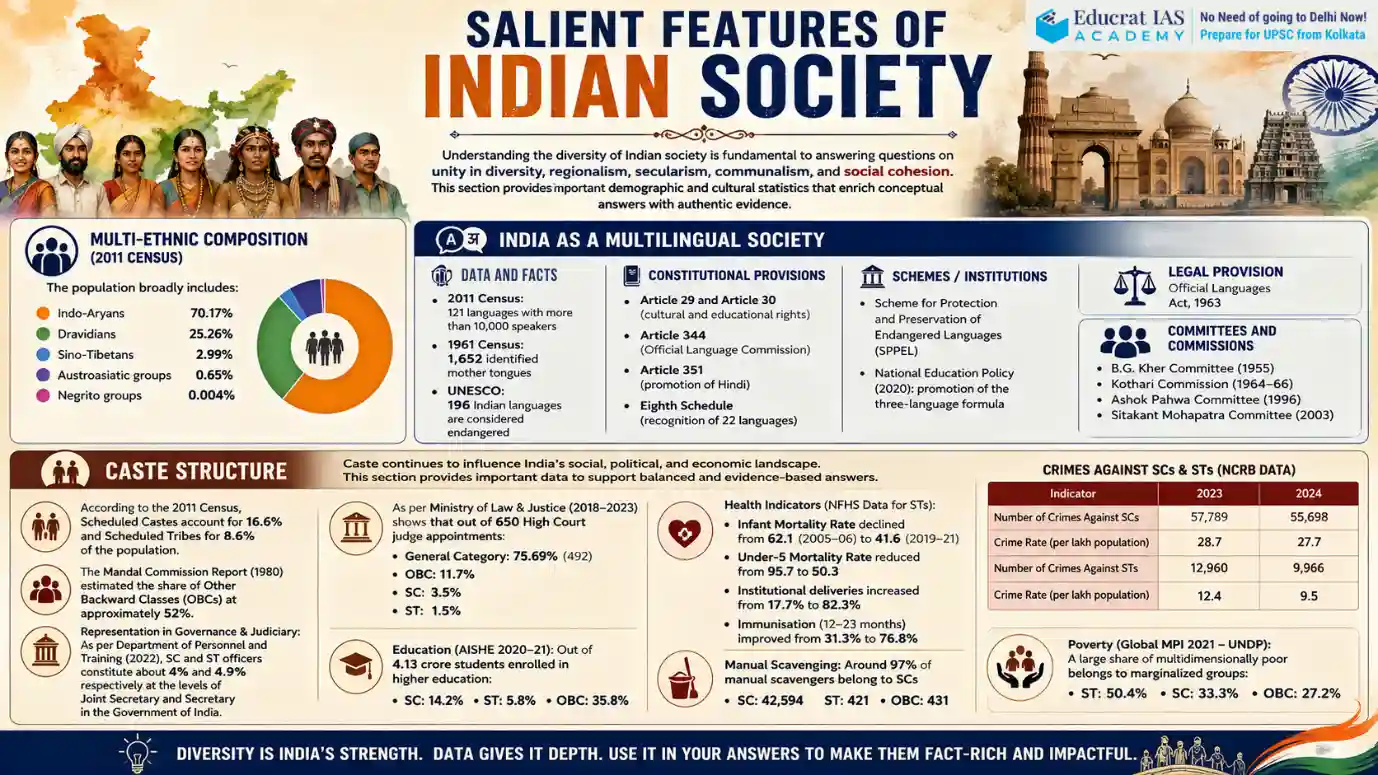
Salient Features of Indian Society
Understanding the diversity of Indian society is fundamental to answering questions on unity in diversity, regionalism, secularism, communalism, and social cohesion. This section provides important demographic and cultural statistics that enrich conceptual answers with authentic evidence.
- Multi-ethnic Composition (2011 Census):The population broadly includes Indo-Aryans (70.17%), Dravidians (25.26%), Sino-Tibetans (2.99%), Austroasiatic groups (0.65%), and Negrito groups (0.004%).
India as a Multilingual Society
India is home to one of the world’s richest linguistic landscapes. Questions on language, identity, education, and federalism can be strengthened using official data on linguistic diversity, constitutional recognition, and language distribution.
- Data and Facts:
- 2011 Census: 121 languages with more than 10,000 speakers
- 1961 Census: 1,652 identified mother tongues
- UNESCO: 196 Indian languages are considered endangered
- Constitutional Provisions:
- Article 29 and Article 30 (cultural and educational rights)
- Article 344 (Official Language Commission)
- Article 351 (promotion of Hindi)
- Eighth Schedule (recognition of 22 languages)
- Schemes / Institutions:
- Scheme for Protection and Preservation of Endangered Languages (SPPEL)
- National Education Policy (2020): promotion of the three-language formula
- Legal Provisions: Official Languages Act, 1963
- Committees and Commissions:
- G. Kher Committee (1955)
- Kothari Commission (1964–66)
- Ashok Pahwa Committee (1996)
- Sitakant Mohapatra Committee (2003)
Caste Structure
Caste continues to influence India’s social, political, and economic landscape. This section provides important data on Scheduled Castes, Other Backward Classes, reservation, social mobility, and inequality to support balanced and evidence-based answers.
- According to the 2011 Census, Scheduled Castes account for 16.6% and Scheduled Tribes for 8.6% of the population.
- The Mandal Commission Report (1980) estimated the share of Other Backward Classes (OBCs) at approximately 52%.
- Representation in Governance & Judiciary: As per Department of Personnel and Training (2022), SC and ST officers constitute about 4% and 4.9%respectively at the levels of Joint Secretary and Secretary in the Government of India.
- As per Ministry of Law & Justice (2018–2023) shows that out of 650 High Court judge appointments: General Category: 69% (492); OBC: 11.7%; SC: 3.5%; ST: 1.5%.
- Education (AISHE 2020–21): Out of 13 crorestudents enrolled in higher education:
- SC: 2%; ST: 5.8%; OBC: 35.8%
- Health Indicators (NFHS Data for STs): Infant Mortality Rate declined from 1 (2005–06)to 41.6 (2019–21)
- Under-5 Mortality Rate reduced from 7to 50.3
- Institutional deliveries increased from 7%to 82.3%
- Immunisation (12–23 months) improved from 3%to 76.8%
| Indicator | 2023 | 2024 |
| Number of Crimes Against SCs | 57,789 | 55,698 |
| Crime Rate (per lakh population) | 28.7 | 27.7 |
| Number of Crimes Against STs | 12,960 | 9,966 |
| Crime Rate (per lakh population) | 12.4 | 9.5 |
- Manual Scavenging: Around 97%of manual scavengers belong to SCs
- SC: 42,594, ST: 421, OBC: 431
- Poverty (Global MPI 2021 – UNDP): A large share of multidimensionally poor belongs to marginalized groups:
- ST: 4%, SC: 33.3%, OBC: 27.2%
Tribal Population and Distribution Statistics for UPSC Mains 2026
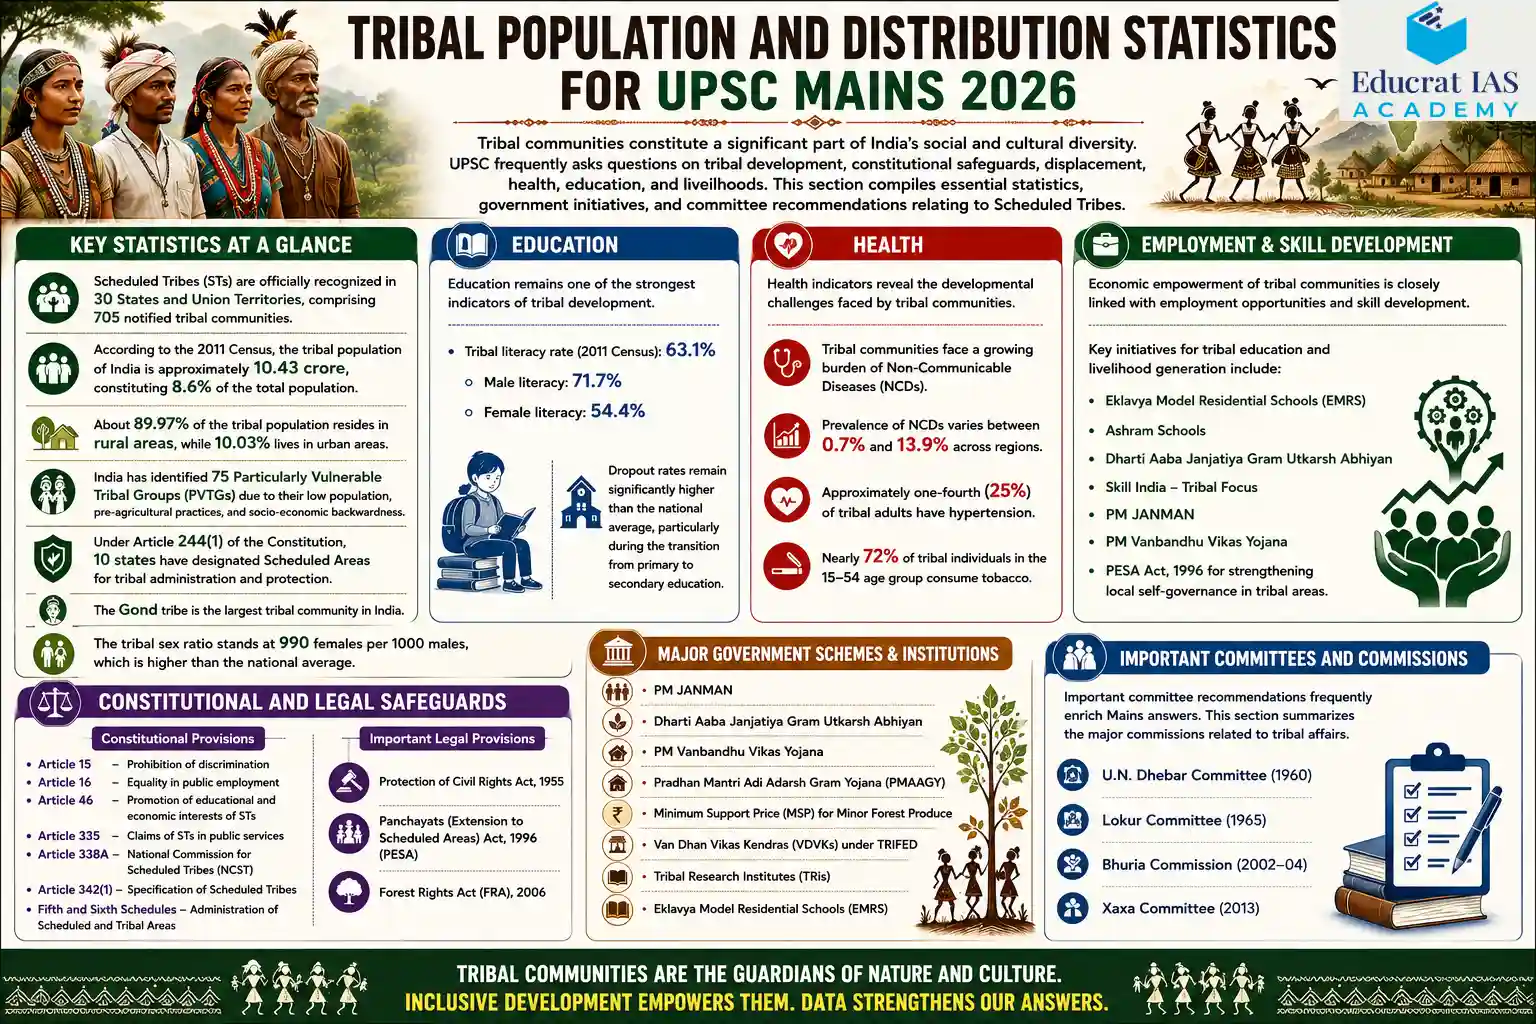
Tribal communities constitute a significant part of India’s social and cultural diversity. UPSC frequently asks questions on tribal development, constitutional safeguards, displacement, health, education, and livelihoods. This section compiles essential statistics, government initiatives, and committee recommendations relating to Scheduled Tribes.
- Scheduled Tribes (STs) are officially recognized in 30 States and Union Territories, comprising 705 notified tribal communities.
- According to the 2011 Census, the tribal population of India is approximately 43 crore, constituting 8.6%of the total population.
- About 97%of the tribal population resides in rural areas, while 10.03% lives in urban areas.
- India has identified 75 Particularly Vulnerable Tribal Groups (PVTGs)due to their low population, pre-agricultural practices, and socio-economic backwardness.
- Under Article 244(1)of the Constitution, 10 states have designated Scheduled Areas for tribal administration and protection.
- The Gondtribe is the largest tribal community in India.
- The tribal sex ratio stands at 990 females per 1000 males, which is higher than the national average.
Education
Education remains one of the strongest indicators of tribal development. This section presents data on literacy, school enrolment, dropout rates, and higher education among Scheduled Tribes.
- Tribal literacy rate (2011 Census): 1%
- Male literacy: 7%
- Female literacy: 4%
- Nearly 50% of tribal children drop outduring the transition from primary to secondary education.
Health
Health indicators reveal the developmental challenges faced by tribal communities. Use these statistics while discussing nutrition, maternal health, infant mortality, and healthcare accessibility.
- Tribal communities face a growing burden of Non-Communicable Diseases (NCDs).
- Prevalence of NCDs varies between 7% and 13.9%across regions.
- Around 25%of tribal populations suffer from hypertension.
- Nearly 72%of tribal individuals in the 15–54 age group consume tobacco.
Employment and Skill Development
Economic empowerment of tribal communities is closely linked with employment opportunities and skill development. This section includes labour force participation, livelihood trends, and government initiatives.
Key initiatives for tribal education and livelihood generation include:
- Eklavya Model Residential Schools (EMRS)
- Ashram Schools
- Janshala Programme
- PESA Act, 1996for strengthening local self-governance in tribal areas.
Constitutional and Legal Safeguards
A concise repository of constitutional provisions, legal protections, and institutional safeguards for Scheduled Tribes useful for GS-II and Polity-based questions.
- Constitutional Provisions
- Article 15– Prohibition of discrimination
- Article 16– Equality in public employment
- Article 46– Promotion of educational and economic interests of STs
- Article 335– Claims of STs in public services
- Article 338A– National Commission for Scheduled Tribes (NCST)
- Article 342(1)– Specification of Scheduled Tribes
- Fifth and Sixth Schedules– Administration of Scheduled and Tribal Areas
- Important Legal Provisions
- Protection of Civil Rights Act, 1955
- Panchayats (Extension to Scheduled Areas) Act, 1996 (PESA)
- Forest Rights Act (FRA), 2006
Major Government Schemes and Institutions
An overview of flagship schemes, ministries, and institutions working towards tribal welfare and inclusive development.
- PM JANMAN
- PM Vanbandhu Vikas Yojana
- Pradhan Mantri Adi Adarsh Gram Yojana (PMAAGY)
- Minimum Support Price (MSP) for Minor Forest Produce
- Van Dhan Vikas Kendras (VDVKs)under TRIFED
- Tribal Research Institutes (TRIs)
- Eklavya Model Residential Schools (EMRS)
Important Committees and Commissions
Important committee recommendations frequently enrich Mains answers. This section summarizes the major commissions related to tribal affairs.
- N. Dhebar Committee (1960)
- Lokur Committee (1965)
- Bhuria Commission (2002–04)
- Xaxa Committee (2013)
PVTGs (Particularly Vulnerable Tribal Groups) Statistics for UPSC Mains 2026
| Aspect | Details |
| Origin | Recommended by Dhebar Commission (1973) |
| Highest Concentration | Odisha (13), followed by Andhra Pradesh (12) |
| Schemes | PMPVTG Development Mission, PM JANMAN |
DNTs (Denotified Tribes) Statistics for UPSC Mains 2026
| Aspect | Details |
| Historical Background | Criminal Tribes Act, 1871 labelled certain tribes as criminals |
| Change | Repealed in 1952, termed as “Denotified Tribes” |
| Schemes/Institutions | SEED Scheme, Development & Welfare Board for DNTs, Ambedkar Scholarships |
| Commission | Renke Commission |
Women and Gender Statistics for UPSC Mains 2026
Role of Women and Women's Organisations
Key Demographic & Social Indicators
Quick-reference data covering literacy, workforce participation, sex ratio, maternal health, and gender development.
- Sex Ratio (Census 2011):943 (2001: 933)
- Highest: Kerala (1084), Puducherry (1037)
- Lowest: Haryana (879)
- Sex Ratio at Birth:899 (Census 2011) → 931 (2018–19, HMIS)
- Literacy Rate (Census 2011):Male – 9%, Female – 64.63%
- Life Expectancy (Census 2011):Overall – 3 years (Male: 66.9, Female: 69.9)
Higher Education (AISHE 2018–19)
- Female share in enrolment: 6%
- GER (Female): 4%| GER (Male): 26.3%
| Parameter | NFHS-5 (2019–21) | NFHS-6 (2023–24) |
| Antenatal Care (Any Visit) | 92.6% (any visit) / 70.0% (first trimester) | 95.9% (any visit) / 76.2% (first trimester) |
| Women with Bank Account (Self-use) | 78.6% | 89.0% |
| Women Using Mobile Phone (Self-use) | 53.9% | 63.6% |
| Women Married Before Age 18 | 23.3% | 20.1% |
Other Indicators of Progress
- Jan Dhan Yojana:Women account holders – 55%
- R&D Participation (DST):Increased from 13% (2000–01) to 28% (2018–19)
- Women MPs (18th Lok Sabha):74 (13.6%)
- Panchayati Raj Institutions:4 million women (46%) of total representatives
Women MPs in Lower House (Global Comparison)
Global comparison of women’s political representation useful for governance and democracy questions.
- Global Standing:As per the Global Gender Gap Report 2023, India ranks 127 out of 146 countries.
| Country | Rwanda | South Africa | Nepal | Bangladesh | India |
| % Women MPs | 61.3 | 42.7 | 32.7 | 20.7 | 13.6 |
Challenges to Women Empowerment
| Indicator | NFHS-5 (2019–21) | NFHS-6 (2023–24) |
| Ever-married women (18–49 years) who experienced spousal violence | 29.2% | 22.3% |
| Women experiencing physical violence during pregnancy | 3.1% | 2.7% |
| Young women (18–29 years) who experienced sexual violence by age 18 | 1.2% | 0.7% |
Crime & Representation
Important statistics on crimes against women and representation in institutions.
- 42 lakh crimes against womenwere registered in 2024 (crime rate declined from 66.2 to 64.6 per lakh women).
- On average, about 50 FIRs were registered every hourfor crimes against women in 2024.
- The charge-sheeting rate stood at 77.2%at the all-India level.
- Women in IAS (1951–2020):13% of total 11,569 officers
Time Use Survey (2024)
Essential statistics on unpaid care work and gender roles.
(% of persons aged 6 years and above participating in activity in a day)
| Activity | Rural | Urban | Rural + Urban (All India) | Male (All India) | Female (All India) |
| Employment and Related Activities | 41.1% | 40.5% | 40.9% | 60.8% | 20.7% |
| Unpaid Domestic Services for Household Members | 54.2% | 53.9% | 54.1% | 27.1% | 81.5% |
| Unpaid Caregiving Services for Household Members | 26.5% | 24.5% | 25.9% | 17.9% | 34.0% |
| Production of Goods for Own Final Use | 21.6% | 6.2% | 16.8% | 13.0% | 20.7% |
| Learning | 21.7% | 20.7% | 21.4% | 22.6% | 20.2% |
| Socialising, Community Participation & Religious Practice | 90.1% | 90.8% | 90.3% | 89.8% | 90.7% |
| Culture, Leisure, Mass Media & Sports | 91.8% | 95.8% | 93.0% | 95.3% | 90.7% |
Women and Health (NFHS-6)
- Menstrual Hygiene (Women 15–24 using hygienic protection methods): 79.2%
- Institutional Births: 90.6%
- Adolescent Pregnancy (Women 15–19 already mothers or pregnant at survey time): 6.7%
Schemes: PMMVY, PMSMA, Anganwadi Services, Ujjwala, SAG
Women in Agriculture
| Indicator | Updated Data |
| Share of Rural Women in Agriculture | 76.95% (2023–24) — up from 71.1% (2018–19) |
| Women’s Share in Total Agri Workforce | 42%+ of total agricultural workforce |
| Rural Female LFPR Trend | 24.6% (2017–18) → 47.6% (2023–24) |
| Land Ownership | 14% operational land holdings owned by women |
| Female-headed Farm Families | 18% of farm families headed by women |
| Female LFPR | 41.7% (2023–24) — PLFS 2023–24 |
| Informal Sector | 90% informally employed — ILO 2024 |
| GDP Contribution | 17% |
| Potential GDP Boost | 27% |
- Schemes:Rashtriya Mahila Kisan Diwas, National Mission for Sustainable Agriculture (NMSA), Paramparagat Krishi Vikas Yojana (PKVY), Mahila Kisan Sashaktikaran Pariyojana (MKSP).
Family Structure (Census 2011 Analysis)
| Aspect | Data |
| Nuclear Families | ~70% |
| Joint/Extended Families | ~20% |
| Urban Nuclear Households | 54.3% (2001) → 52.3% |
| Rural Nuclear Households | 50.7% → 52.1% |
| Joint Families (India) | 19.1% (3.69 cr) → 16.1% (4 cr) |
| Rural Joint Families | 20.1% → 16.8% |
| Urban Joint Families | 16.5% → 14.6% |
Religion Statistics for UPSC Mains 2026
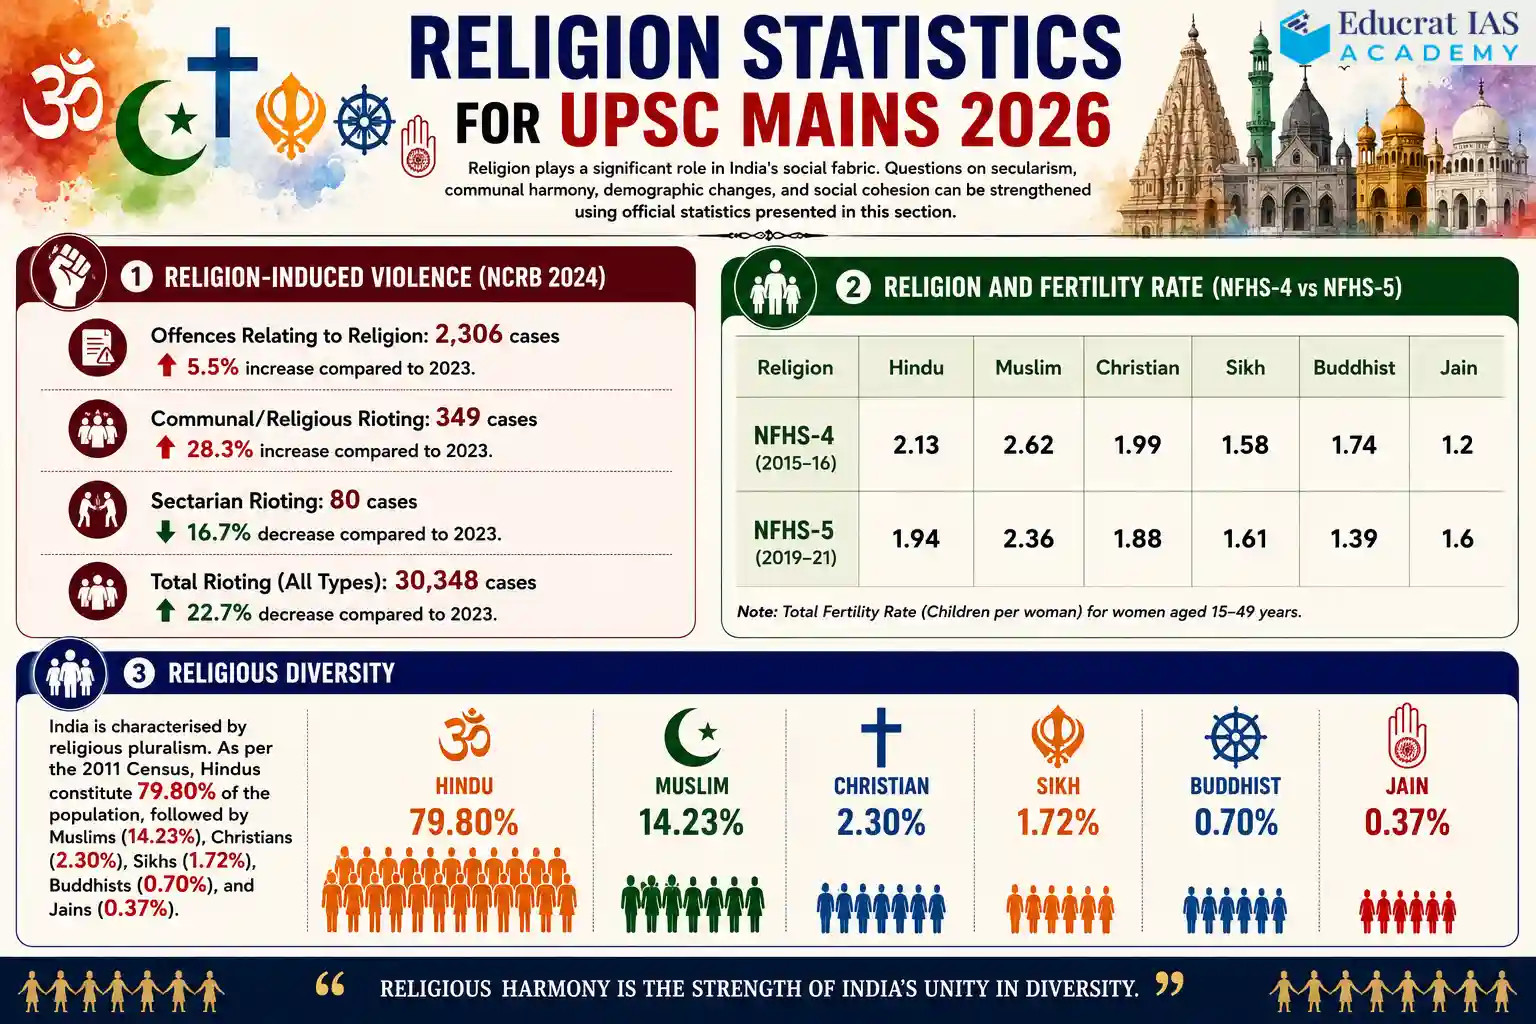
Religion-Induced Violence (NCRB 2024)
- Offences Relating to Religion:2,306 cases
- ⬆️ 5% increasecompared to 2023.
- Communal/Religious Rioting:349 cases
- ⬆️ 3% increasecompared to 2023.
- Sectarian Rioting:80 cases
- ⬇️ 7% decreasecompared to 2023.
- Total Rioting (All Types):30,348 cases
- ⬇️ 22.7% decrease compared to 2023.
Religion and Fertility Rate (NFHS-4 vs NFHS-5)
| Religion | Hindu | Muslim | Christian | Sikh | Buddhist | Jain |
| NFHS-4 | 2.13 | 2.62 | 1.99 | 1.58 | 1.74 | 1.2 |
| NFHS-5 | 1.94 | 2.36 | 1.88 | 1.61 | 1.39 | 1.6 |
Religious Diversity
- India is characterised by religious pluralism. As per the 2011 Census, Hindus constitute 79.80% of the population, followed by Muslims (14.23%), Christians (2.30%), Sikhs (1.72%), Buddhists (0.70%), and Jains (0.37%).
Children and Related Issues Statistics for UPSC Mains 2026
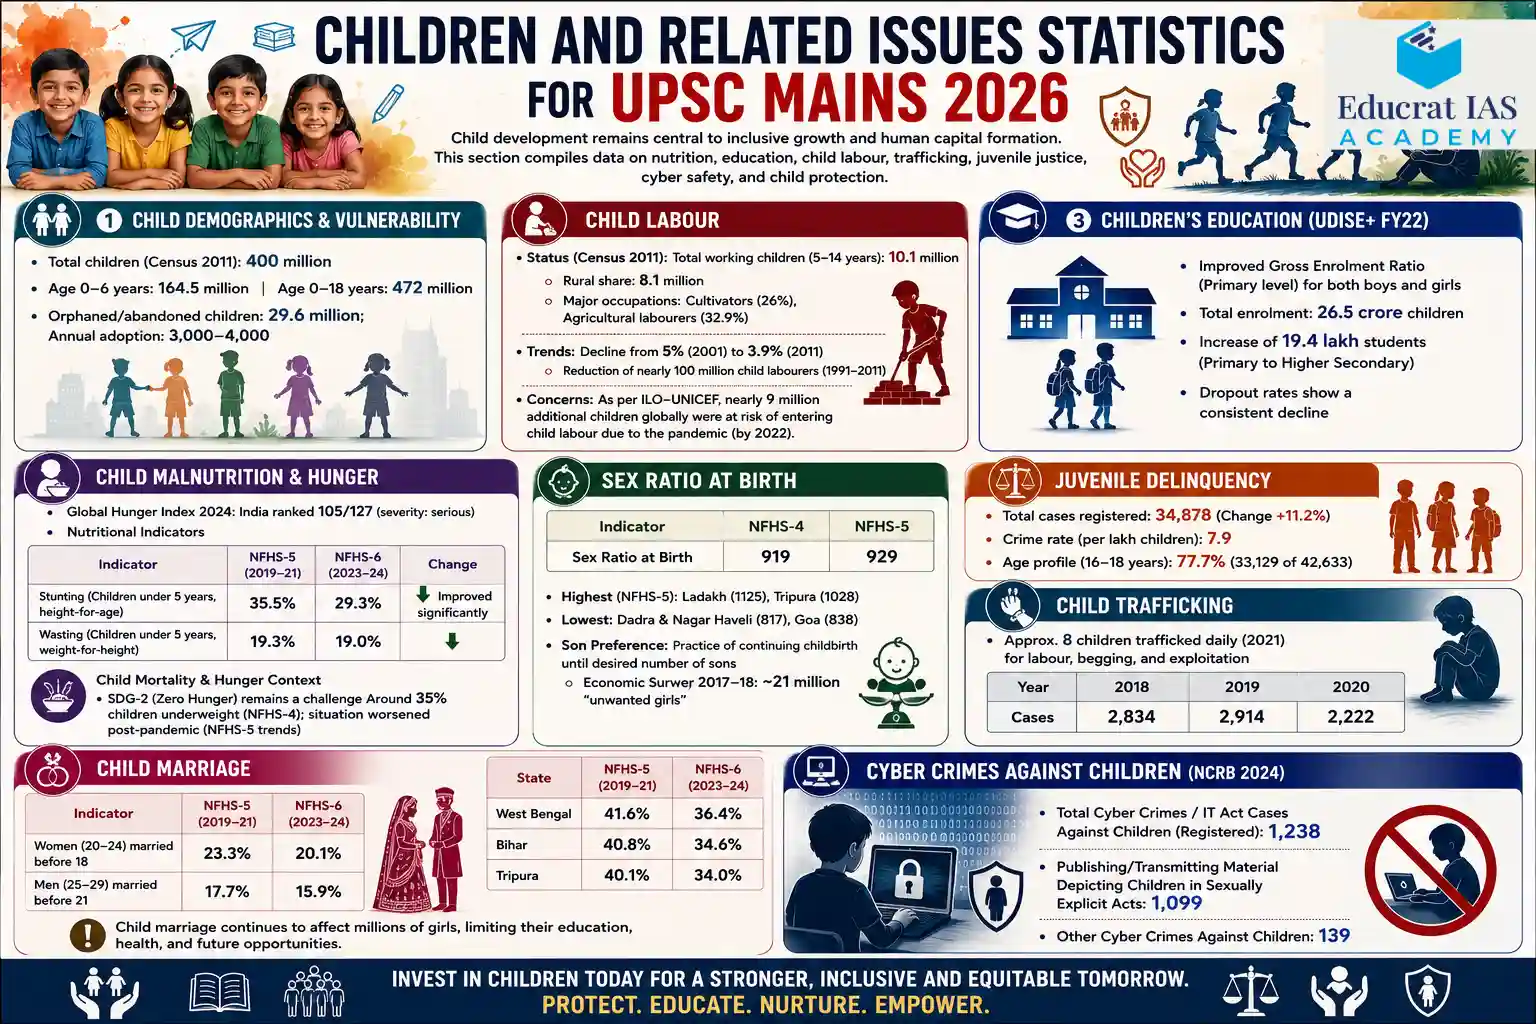
Child Demographics & Vulnerability
- Total children (Census 2011): 400 million
- Age 0–6 years: 5 million| Age 0–18 years: 472 million
- Orphaned/abandoned children: 6 million; Annual adoption: 3,000–4,000
Child Labour
- Status (Census 2011): Total working children (5–14 years): 1 million
- Rural share: 1 million
- Major occupations: Cultivators (26%), Agricultural labourers (32.9%)
- Trends: Decline from 5% (2001)to 9% (2011)
- Reduction of nearly 100 million child labourers (1991–2011)
- Concerns: As per ILO–UNICEF, nearly 9 million additional childrenglobally were at risk of entering child labour due to the pandemic (by 2022).
Children’s Education (UDISE+ FY22)
- Improved Gross Enrolment Ratio (Primary level)for both boys and girls
- Total enrolment: 5 crore children
- Increase of 4 lakh students(Primary to Higher Secondary)
- Dropout ratesshow a consistent decline
Child Malnutrition & Hunger
- Global Hunger Index 2024:India ranked 105/127 (severity: serious)
- Nutritional Indicators
| Indicator | NFHS-5 (2019–21) | NFHS-6 (2023–24) | Change |
| Stunting (Children under 5 years, height-for-age) | 35.5% | 29.3% | ⬇️ Improved significantly |
| Wasting (Children under 5 years, weight-for-height) | 19.3% | 19.0% | ⬇️ |
Child Mortality & Hunger Context
- SDG-2 (Zero Hunger)remains a challenge Around 35% children underweight (NFHS-4); situation worsened post-pandemic (NFHS-5 trends)
Sex Ratio at Birth
| Indicator | NFHS-4 | NFHS-5 |
| Sex Ratio at Birth | 919 | 929 |
- Highest (NFHS-5):Ladakh (1125), Tripura (1028)
- Lowest:Dadra & Nagar Haveli (817), Goa (838)
- Son Preference: Practice of continuing childbirth until desired number of sons
- Economic Survey 2017–18:~21 million “unwanted girls”
Juvenile Delinquency
- Total cases registered: 34,878 (Change +11.2%)
- Crime rate (per lakh children): 7.9
- Age profile (16–18 years): 77.7% (33,129 of 42,633)
Child Trafficking
- 8 children trafficked daily (2021) for labour, begging, and exploitation
| Year | 2018 | 2019 | 2020 |
| Cases | 2,834 | 2,914 | 2,222 |
Child Marriage
| Indicator | NFHS-5 (2019–21) | NFHS-6 (2023–24) |
| Women (20–24) married before 18 | 23.3% | 20.1% |
| Men (25–29) married before 21 | 17.7% | 15.9% |
| State | NFHS-5 | NFHS-6 |
| West Bengal | 41.6% | 36.4% |
| Bihar | 40.8% | 34.6% |
| Tripura | 40.1% | 34.0% |
Cyber Crimes Against Children (NCRB 2024)
- Total Cyber Crimes / IT Act Cases Against Children (Registered): 1,238
- Publishing/Transmitting Material Depicting Children in Sexually Explicit Acts: 1,099
- Other Cyber Crimes Against Children: 139
Persons with Disabilities (PwDs) Statistics for UPSC Mains 2026
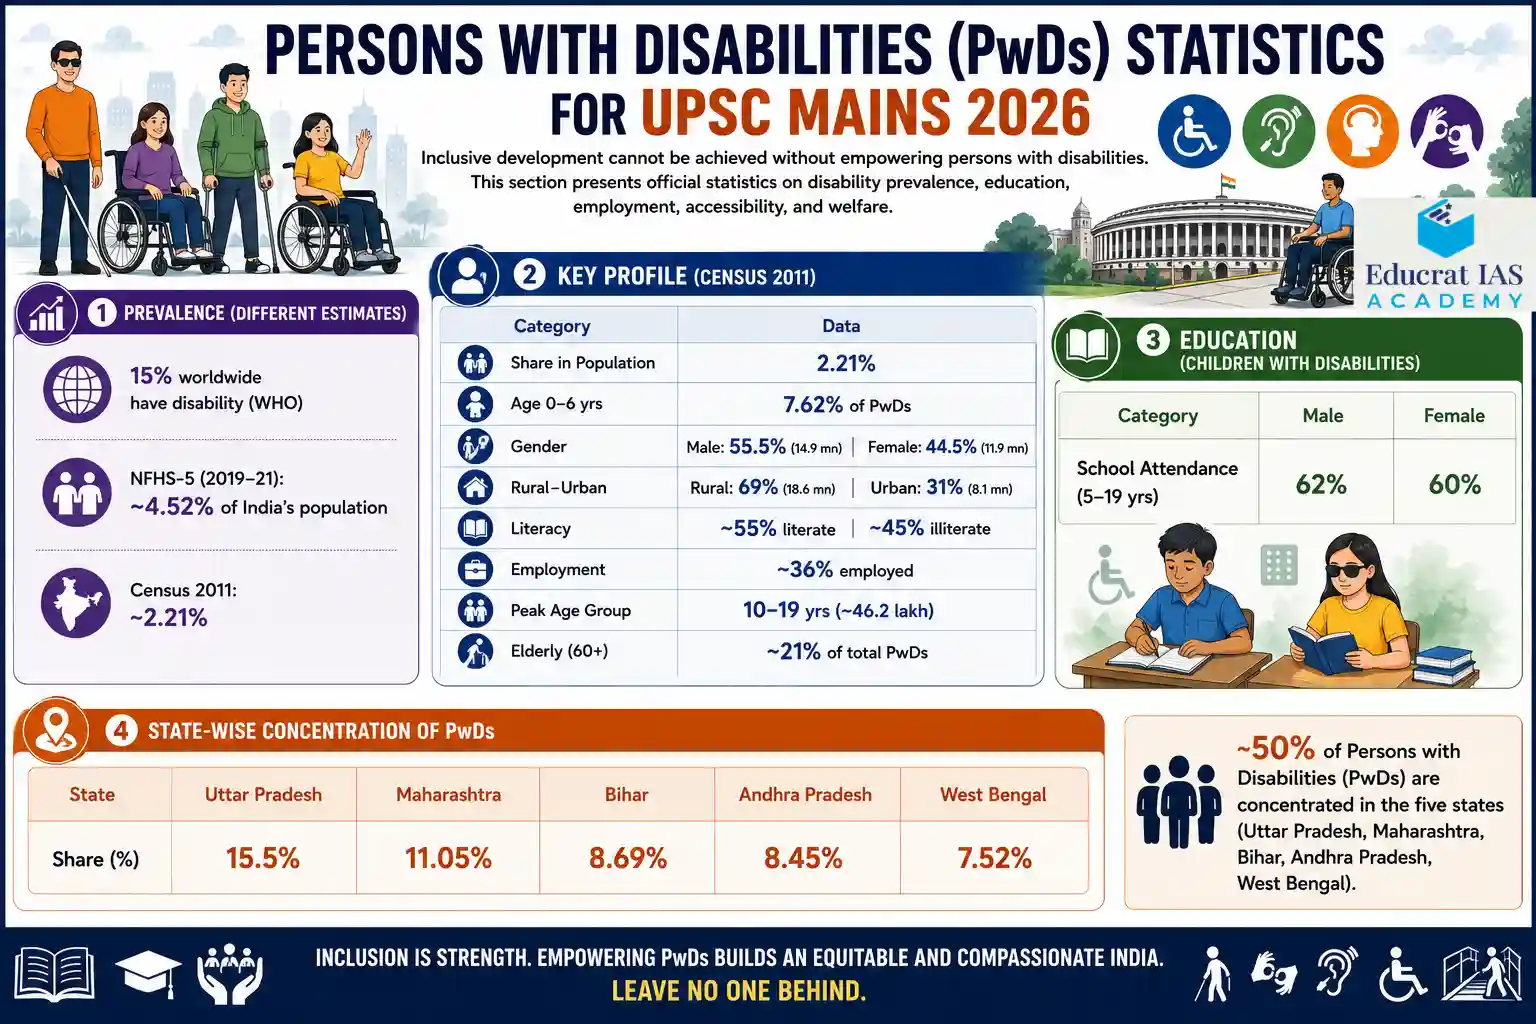
Prevalence (Different Estimates):
- 15% worldwide have disability (WHO)
- NFHS-5 (2019–21):~4.52% of India’s population
- Census 2011: ~2.21%
Key Profile (Census 2011)
| Category | Data |
| Share in Population | 2.21% |
| Age 0–6 yrs | 7.62% of PwDs |
| Gender | Male: 55.5% (14.9 mn) | Female: 44.5% (11.9 mn) |
| Rural–Urban | Rural: 69% (18.6 mn) | Urban: 31% (8.1 mn) |
| Literacy | ~55% literate | ~45% illiterate |
| Employment | ~36% employed |
| Peak Age Group | 10–19 yrs (~46.2 lakh) |
| Elderly (60+) | ~21% of total PwDs |
Education (Children with Disabilities)
| Category | Male | Female |
| School Attendance (5–19 yrs) | 62% | 60% |
State-wise Concentration of PwDs
| State | Uttar Pradesh | Maharashtra | Bihar | Andhra Pradesh | West Bengal |
| Share (%) | 15.5% | 11.05% | 8.69% | 8.45% | 7.52% |
- ~50% of Persons with Disabilities (PwDs) are concentrated in the five states (Uttar Pradesh, Maharashtra, Bihar, Andhra Pradesh, West Bengal).
Elderly Population Statistics for UPSC Mains 2026 (India Ageing Report 2023)
India is experiencing a rapid demographic transition towards an ageing society. This section highlights the latest findings from the India Ageing Report 2023, covering demographic trends, healthcare, social security, old-age dependency, and policy challenges.
Key Trends
- Rapid Ageing:Decadal growth ~41%; Elderly share >20% by 2050; Will outnumber children by 2046
- Oldest-old Growth:80+ population expected to rise ~279% (2022–2050)
- Feminisation of Ageing:Higher female life expectancy (e.g., Himachal Pradesh & Kerala: +4 years vs men at 60)
- Economic Vulnerability:~40% elderly in lowest wealth quintile
- Regional Variation:Higher elderly share in southern states + Himachal Pradesh, Punjab; gap likely to widen by 2036

Transgender Population Statistics for UPSC Mains 2026
Demography
| Indicator | Total Population (2011) | Highest State | Lowest Region | Transgender Children |
| Data | ~4.88 lakh | Uttar Pradesh (1.37 lakh) | Lakshadweep (2) | ~55,000 |
Socio-Economic Status
- Employment:~6% formal sector; ~5% in sex work & domestic work; ~92% excluded from economic participation
- Health:HIV prevalence ~14.5%
- Education:Literacy rate ~56.1%
- Political Participation:~30,000 registered voters
Population & Demographic Dividend
| Census 2011 | Current Pop. | Global Share | TFR |
| 1.21 bn | ~1.42 bn | ~17.8% | 2.2 → 2.0 |
Legal/Policy Framework
- Family Planning Programme (1952)
- National Population Policy (2000)
- Mission Parivar Vikas
Demographic Dividend
- Working-age (15–59 yrs): ~62.5%, expected peak ~65% by 2036
- LFPR: 8%
- ~40% working-age population without jobs (PLFS 2022–23)
- TFR at 0 (below replacement level)
- India became the most populous country in 2023(~17.5% of global population).
- Population projected to reach ~1.67 billion by 2050, then stabilise.
- Growth Trends
- 1891–1921:Stagnation due to epidemics/famines.
- 1921–1951:Rapid rise (“Great Divide”).
- 1951–1981:Population explosion phase.
- Post-1981:Growth slowing steadily.
- Drivers of Decline
- Improved life expectancy (~32 years in 1947 → ~70 years).
- IMR reduced to ~32 per 1000 (NFHS-5).
- Contraceptive use increased (~54% → 67%).
- Rising education and institutional deliveries (~89%).
- Age Structure (NFHS-6)
| Indicator | NFHS-5 | NFHS-6 (2023–24) |
| Population below age 5 years | 8.2% | 8.0% |
| Population below age 15 years | 26.5% | 25.5% |
| Population age 60+ years | 11.8% | 12.9% |
Final Reminder for UPSC Aspirants
Conclusion
Success in UPSC Mains is not determined solely by conceptual understanding—it is also shaped by the ability to substantiate arguments with authentic facts, government reports, and credible statistics. Thoughtfully integrating relevant data into your answers demonstrates analytical depth, strengthens arguments, and reflects a well-informed perspective, all of which are valued by UPSC examiners.
This comprehensive UPSC Mains 2026 Data Compilation has been designed to save you countless hours of research by bringing together the most important statistics from official sources such as the Census, Economic Survey, NFHS, NCRB, NITI Aayog, Ministry reports, and international organisations. Whether you are preparing for GS Papers, Essay, Ethics, or Optional subjects, this resource can serve as your go-to repository for factual value addition.
Use these statistics wisely—not by memorising every figure, but by selecting the most relevant data to support your arguments naturally. Combined with sound analysis, balanced viewpoints, and clear presentation, these official facts can help transform average answers into high-scoring ones.